Announcement and Release of Apple iPhone 7
AAPL announced it’s new iPhone 7 on September 9, 2016 and it was released on September 16, 2016 in 30 countries around the world including the US and UK. Release of iPhone 7 is expected to happen in another 30 countries in another week. AAPL stock opened at 104.64 on September 9, 2016 (the day of announcement) and on September 12, reached a low of 101.77 after which it started an aggressive rally which broke above August 16, 2016 peak at 110.23 and made a new high for the year. It closed at 114.92 on September 16, 2016 which mean it has gained 9.8% since it was announced.
Historical performance of AAPL following release of an iPhone model
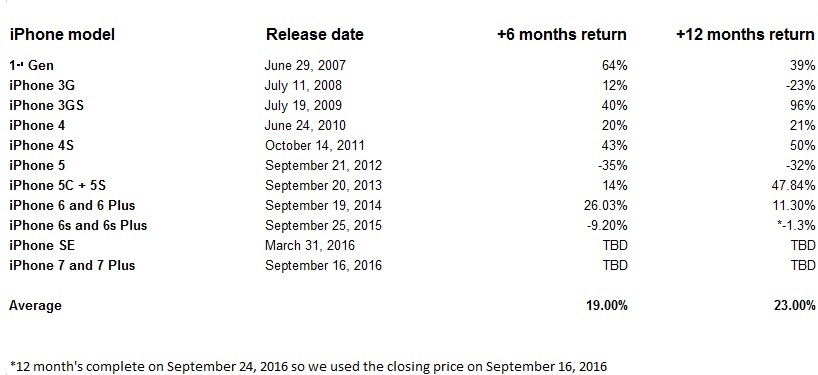
Historically, 6 months from the release date, AAPL has gained 19% on average and this increased to 23% on average 12 months from the release date. Only 2 of 11 releases so far (counting models released on the same date as a single release) generated negative 6 month returns, 7 generated positive 6 month returns and we still need more data for the last 2 releases. Talking about 12 month returns, only 3 out of 11 releases so far generated negative returns, 6 generated positive 12 month returns and we still need more data for the last 2 releases. Opening price on September 16, 2016 was 115.12 and if AAPL manages the average 6 month return following release on an iPhone model, it would be trading at 137.00 by March 15, 2017 and if it manages the average 12 month return following release of an iPhone model, it would end up at 141.60 by September 15, 2017. Past performance can’t guarantee future results which means we need to take a look at the technical picture of the stock to get an idea about it’s future direction.
Technical Picture
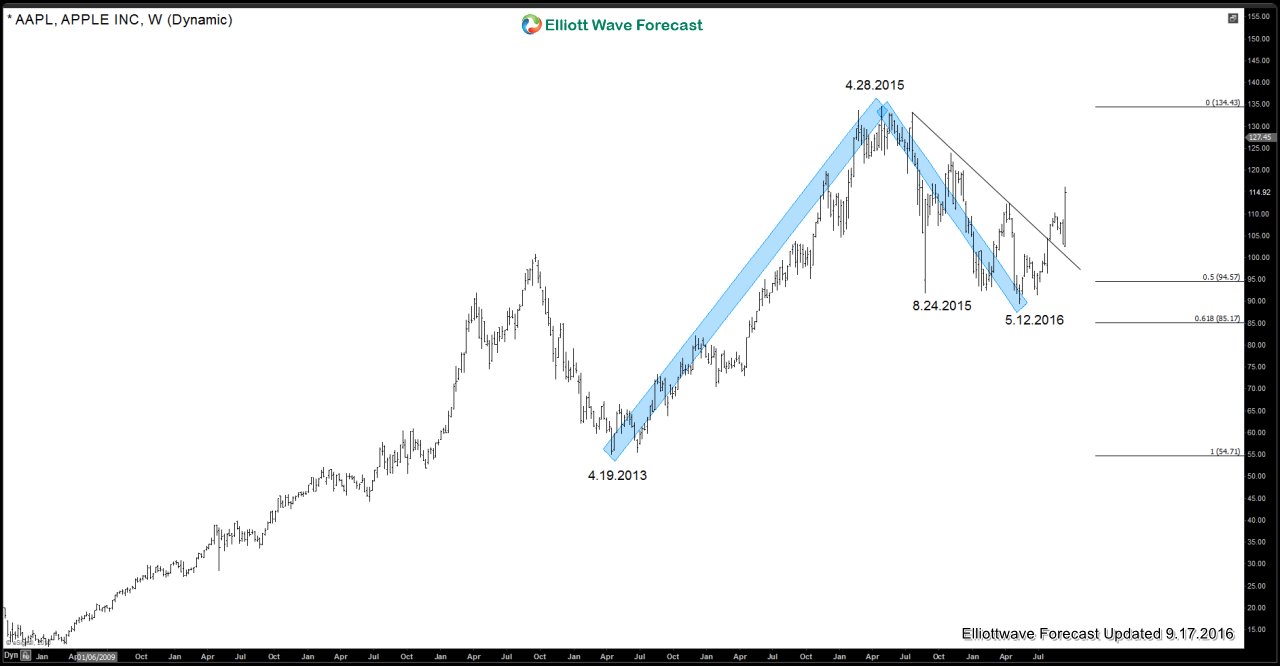
AAPL cycle from April 19, 2013 (55.01) ended on April 28, 2015 (134.54) after which the stock started pulling back and correct more than 50% of the cycle from April 19, 2013 low (see chart below). It reached a low of 89.47 on May 12, 2016 after which it has been rallying again, it has broken above the down trend line from April 2015 peak and also retraced more than 50% of the decline from April 2015 peak which means cycle from April 2015 peak is over at May 12, 2016 low. It remains to be seen whether this is the start of a new daily cycle higher or just another bounce into a sideways consolidation or a double correction from April 2015 peak. NASDAQ, the underlying Index, has already broken above 2015 peak which supports the idea of a new daily cycle starting but it does need to break above April 28, 2015 (134.54) peak to add more conviction to this view.
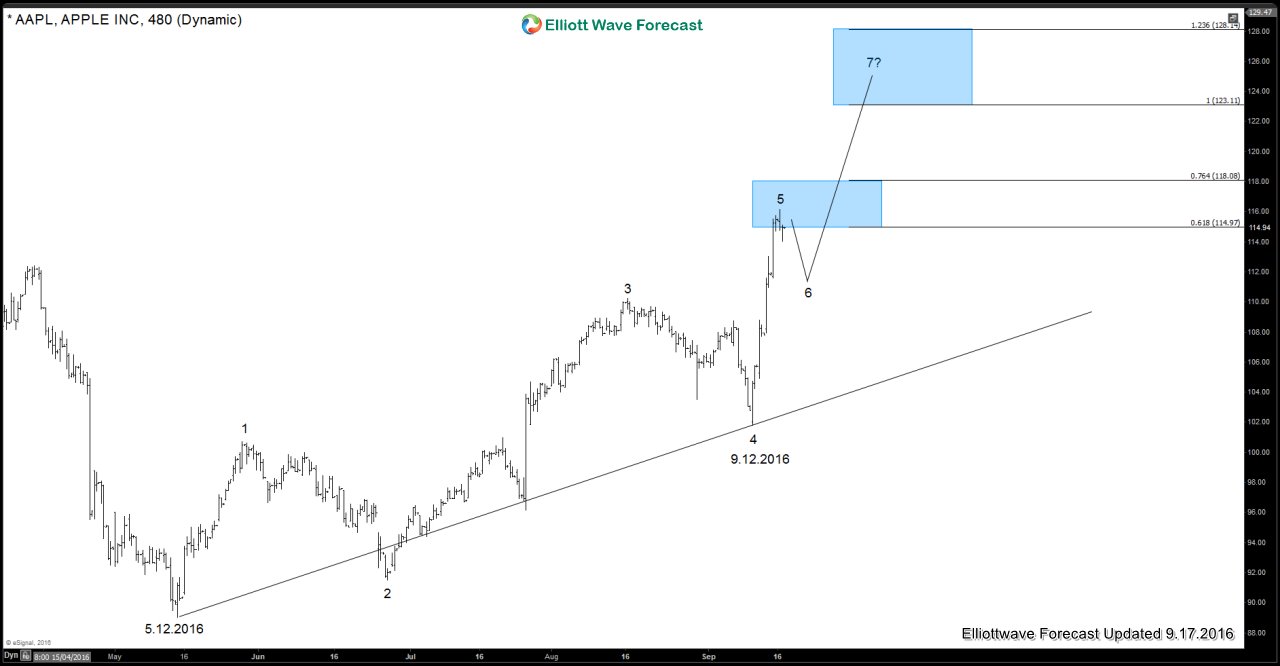
Dropping down to the 480 minute chart, we can count 5 swings up from 5.12.2016 low which makes it an incomplete sequence. We do want to point out that structure of the move up is not impulsive and there is no RSI (momentum) divergence between the proposed 3rd and 5th swing due to which these are not 5 waves, rather 5 swings. 5 swings is an incomplete sequence which makes Elliott wave swing sequence bullish against 9.12.2016 low. Thus, as far as pivot at 9.12.2016 low remains intact, we expect dips to remain supported and find buyers in 3, 7 or 11 swings looking higher towards 123.11 – 128.14 area to complete 7 swings up from 5.12.2016 low. Then, we should see a 3 wave pull back at least to correct the cycle from 9.12.2016 low and ideally from 5.12.2016 low.
We hope you enjoyed this article about APPL stock and where it could be headed in the near-future. To view full Elliott Wave Analysis of the stock in 4 time frames (Weekly, Daily, 4 Hour and 1 Hour) and to access forecasts for many other World Indices like SPX, ES_F, Dow, Russell, NASDAQ, Nikkei, DAX, FTSE, IBEX, Eurostoxx, Hangseng, ASX, Nifty, TASI and many other Forex pairs, commodities and 10 year yields, sign up for a Free 14 day Trial here (new members only)
To learn more about the sequence of 3, 7 or 11 swings and how we use it on forecasting / trading and to receive 1-1 coaching, check our NEW Educational website
Back


