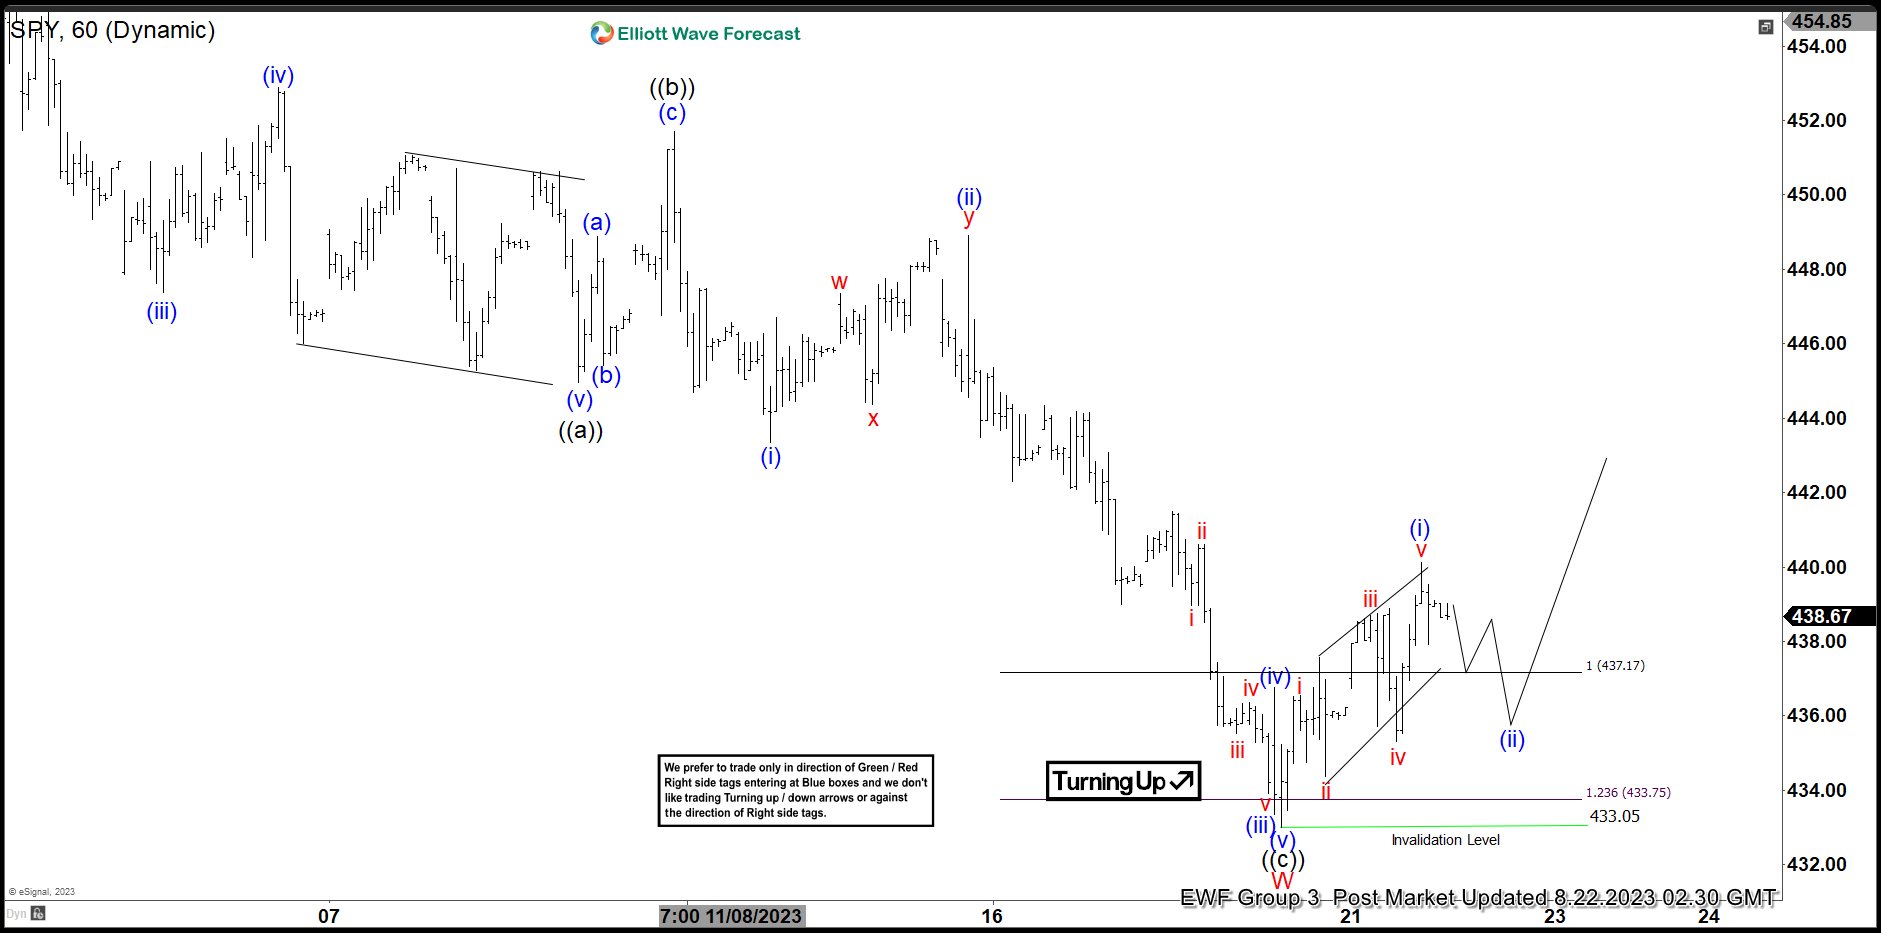
Short Term Elliott Wave view in S&P 500 ETF (SPY) suggests the decline from 7.27.2023 high is in progress as a double three Elliott Wave structure. Down from 7.27.2023 high, wave ((a)) ended at 444.96 and rally in wave ((b)) ended at 451.7. The ETF then extended lower in wave ((c)). Down from wave ((b)), wave (i) ended at 443.35 and rally in wave (ii) ended at 448.92. The ETF extended lower again in wave (iii) towards 433.93 and wave (iv) rally ended at 436.77. Final leg wave (v) lower ended at 433.05 which completed wave ((c)) of W.
Wave X rally is now in progress to correct cycle from 7.27.2023 high before the next leg lower. Up from wave W, wave i ended at 436.55 and wave ii ended at 434.38. Wave iii ended at 438.89, wave iv ended at 435.32, and wave v ended at 440.11 which completed wave (i). Expect wave (ii) pullback to correct cycle from 8.18.2023 low before it turns higher again. Near term, as far as pivot at 433.05 low stays intact, the ETF can see further upside to correct cycle from 7.27.2023 high before it turns lower again.


