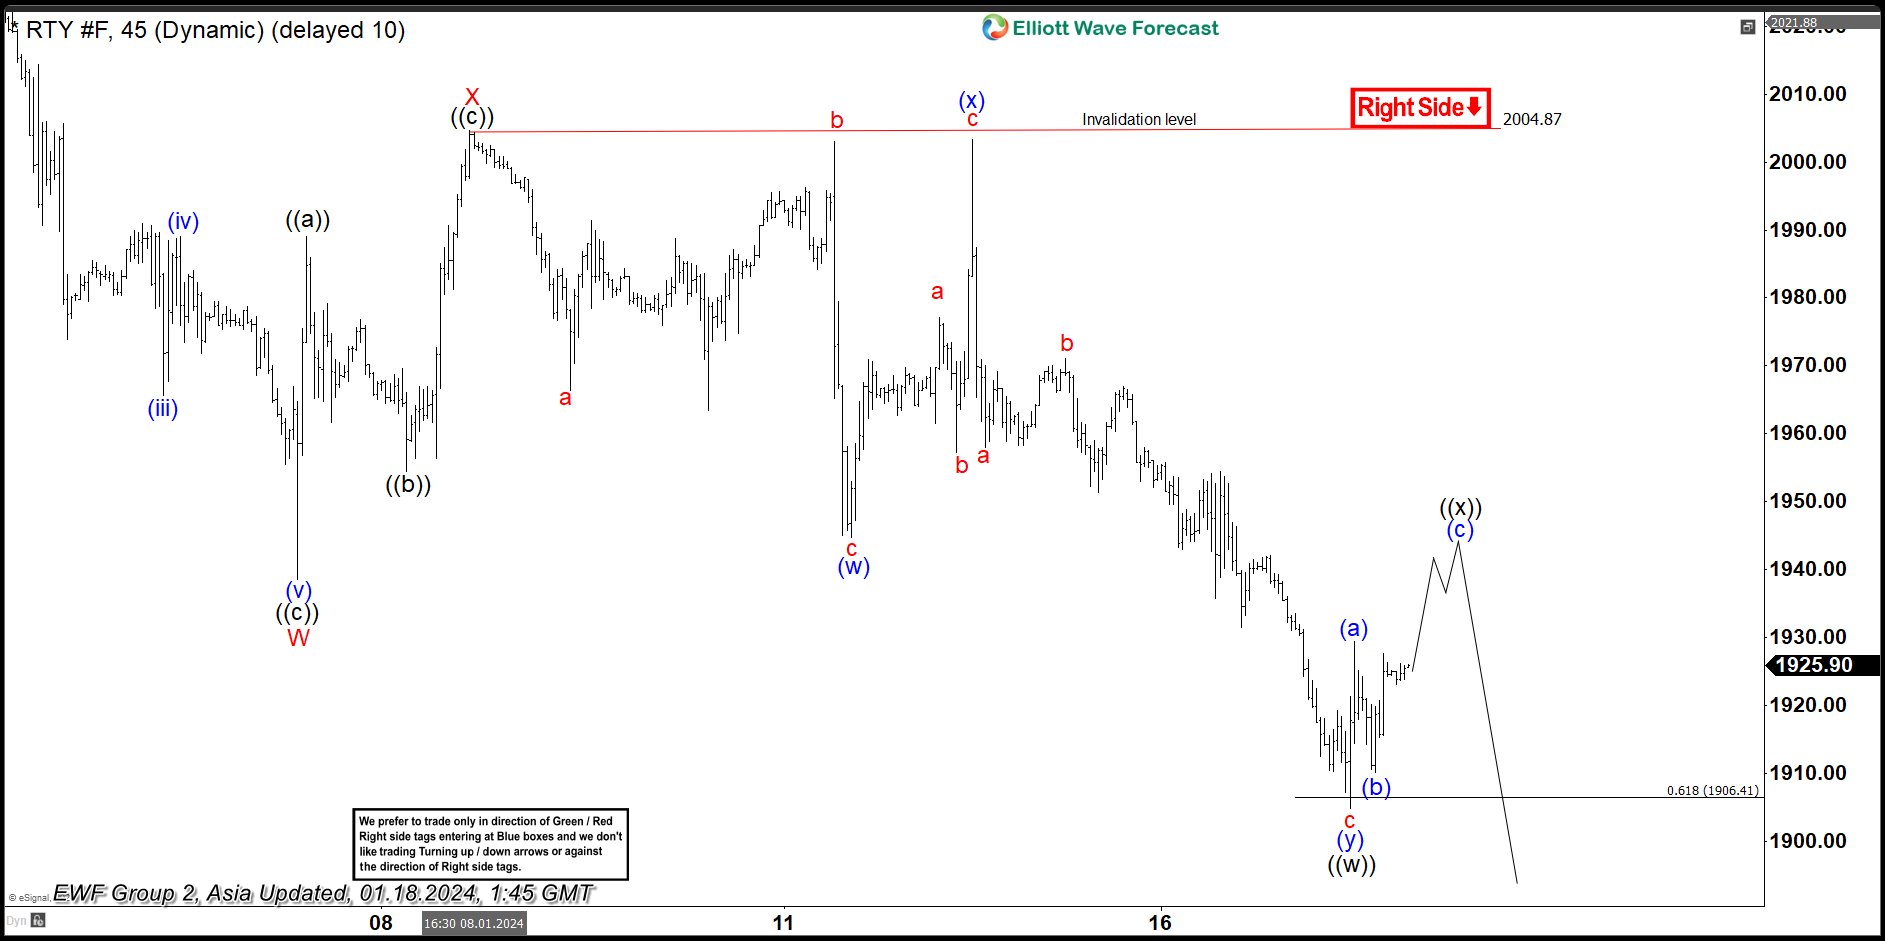
Short term Elliott Wave View in Russell 2000 (RTY) suggests the decline from 12.28.2023 high is unfolding as a double three Elliott Wave structure. Down from 12.28.2023 high, wave W ended at 1938.6 and wave X ended at 2004.87. Wave Y lower is in progress as another double three in lesser degree. Down from wave X, wave a ended at 1966.4 and wave b ended at 2003.10. Wave c lower ended at 1944.70 which completed wave (w). From there, wave (x) rally ended at t 2003.30 as a zigzag. Up from wave (w), wave a ended at 1977.10 and wave b ended at 1957.30. Wave c ended at 2003.30 which completed wave (x) in higher degree.
Index resumes lower in wave (y) with internal subdivision as a zigzag. Down from wave (x), wave a ended at 1958 and wave b rally ended at 1971.10. Wave c lower ended at 1904.80 which completed wave (y) of ((w)). Expect Index to rally in wave ((x)) to correct cycle from 1.9.2024 high before it resumes lower. Rally is unfolding as a zigzag where wave (a) ended at 1929.4 and wave (b) ended at 1910.10. Expect wave (c) higher to end at 1934.2 – 1949.9 area which should complete wave ((x)) in higher degree. Near term, as far as pivot at 2004.87 high stays intact, expect rally to fail in 3, 7, 11 swing for further downside.


