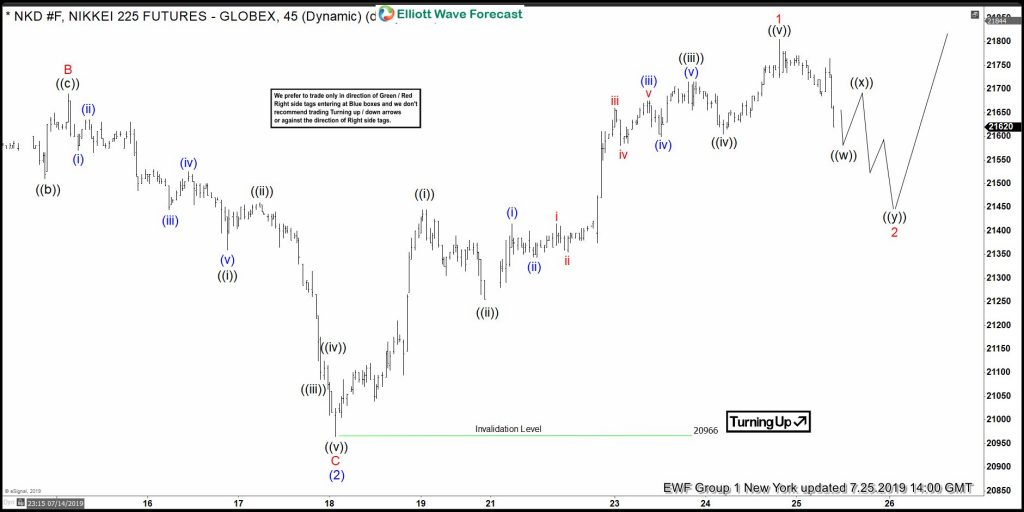
In Nikkei, the decline to 20966 low ended the wave (2) pullback & also completed the correction against 6/03/2019 low. The internals of that pullback unfolded as Elliott wave zigzag structure where the first leg ended in wave A ended at 21495 low. Up from there, the 3 wave bounce to 21690 high ended wave B. Down from there, the index made a 5 waves decline as Elliott wave impulse structure where wave ((i)) ended at 21360. Wave ((ii)) ended at 21460 high, wave ((iii)) ended at 21085 low. Wave ((iv)) ended at 21125 and wave ((v)) ended at 20966 low, which also completed the wave C of (2).
Up from that low, the index can be nesting higher in an impulse structure where initial rally to 21445 ended wave ((i)) in lesser degree 5 waves structure. Down from there, the index made a wave ((ii)) pullback ended at 21255 low. Above from that low, a rally higher to 21715 high ended wave ((iii)). Wave ((iv)) ended at 21605 low and wave ((v)) ended at 21805 high which also completed wave 1. Below from 21805 high, the pullback in wave 2 remains in progress to correct the rally from 20966 low in 3, 7 or 11 swings before more upside can be seen. We don’t like selling the index. And as far as dips remain above 20966 low expect more upside to take place.
Nikkei 1 Hour Elliott Wave Chart


