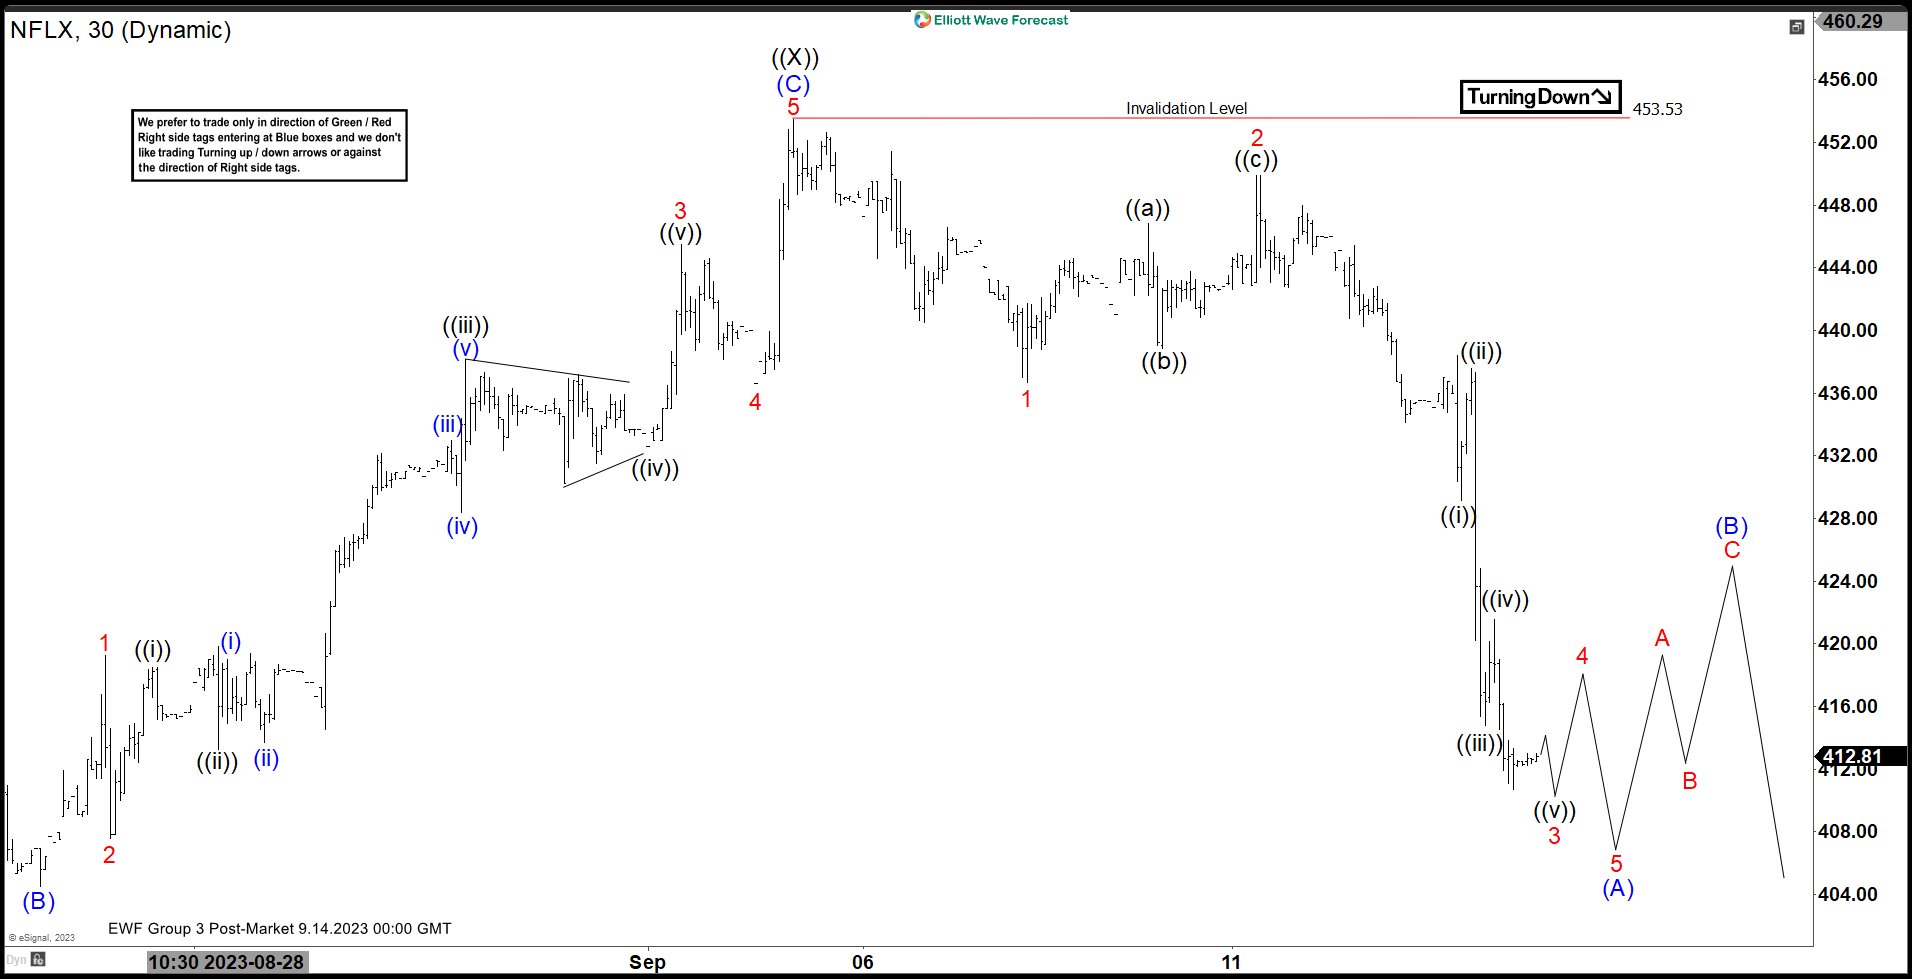
Netflix (NFLX) decline from 7.20.2023 high is unfolding as a double three Elliott Wave structure. Down from 7.20.2023 high, wave (A) ended at 411.88 and rally in wave (B) ended at 445.25. Wave (C) lower ended at 398.15 which completed wave ((W)). Rally in wave ((X)) ended at 453.53 with internal subdivision as a zigzag strcuture. Up from wave ((W)), wave (A) ended at 437.02 and pullback in wave (B) ended at 404.50. Wave (C) lower took the form of a 5 waves impulse which ended at 453.53 as the 30 minutes chart below shows. This completed wave ((X)) in higher degree. The stock then turned lower in wave ((Y)).
Down from wave ((X)), wave 1 ended at 436.7 and rally in wave 2 ended at 449.89. Internal subdivision of wave 2 unfolded as a zigzag. Up from wave 1, wave ((a)) ended at 446.81, pullback in wave ((b)) ended at 438.85 and wave ((c)) higher ended at 449.88 which completed wave 2. Down from wave 2, wave ((i)) ended at 429.17 and wave ((ii)) ended at 437.59. Wave ((iii)) ended at 414.81 and wave ((iv)) ended at 421.55. Expect the stock to extend lower in wave ((v)) which should complete wave 3. Afterwards, it should rally in wave 4 before another leg lower to end wave 5 of (A). Near term, as far as pivot at 453.53 high stays intact, expect rally to fail in 3, 7, or 11 swing for further downside.


