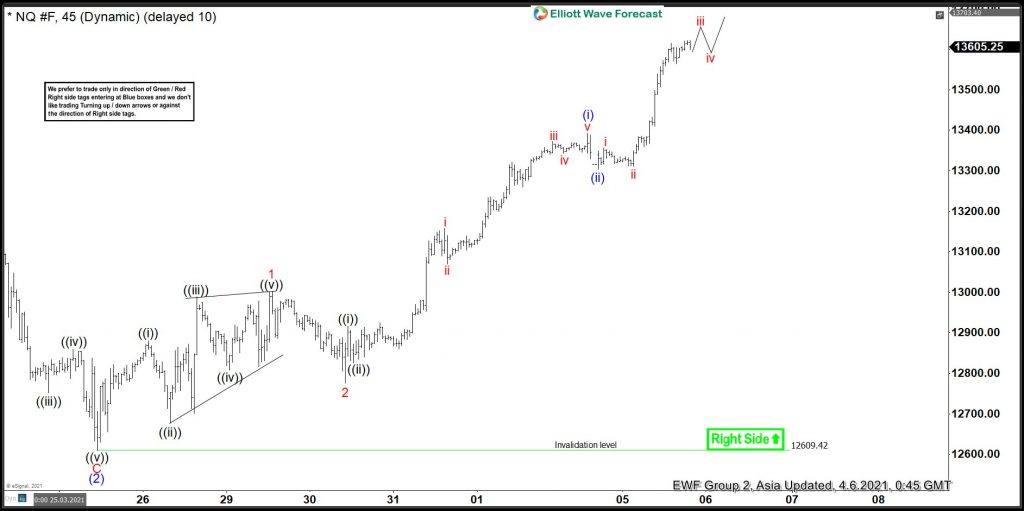
Short term Elliott wave in NASDAQ suggests that the cycle from March 05, 2021 low is unfolding as an impulse sequence. Up from March 05 low, the rally to $13287.25 high ended wave (1). Down from there, the pullback in wave (2) unfolded as a zigzag structure where wave A ended at $12681.75. Wave B bounce ended at $13172 high and wave C ended at $12609.42 low thus completed wave (2) pullback.
Above from there, the initial bounce in wave 1 unfolded as a diagonal where wave ((i)) ended at $12881 high. Wave ((ii)) ended at $12676.25 low, wave ((iii)) ended at $12988.50, wave ((iv)) ended at $12807.50 low and wave ((v)) ended at $13003 high. Then the pullback to $12776.50 low ended wave 2 & index has turned higher in a nest within wave 3 of (3) favoring more upside. Near-term, while dips remain above $12609.42 low expect index to extend higher in a nest looking for more upside towards $13689.46 -$14357.63 area higher before a pullback can take place. We don’t recommend selling the index and expect dips to find support in 3, 7, or 11 swings for further upside.


