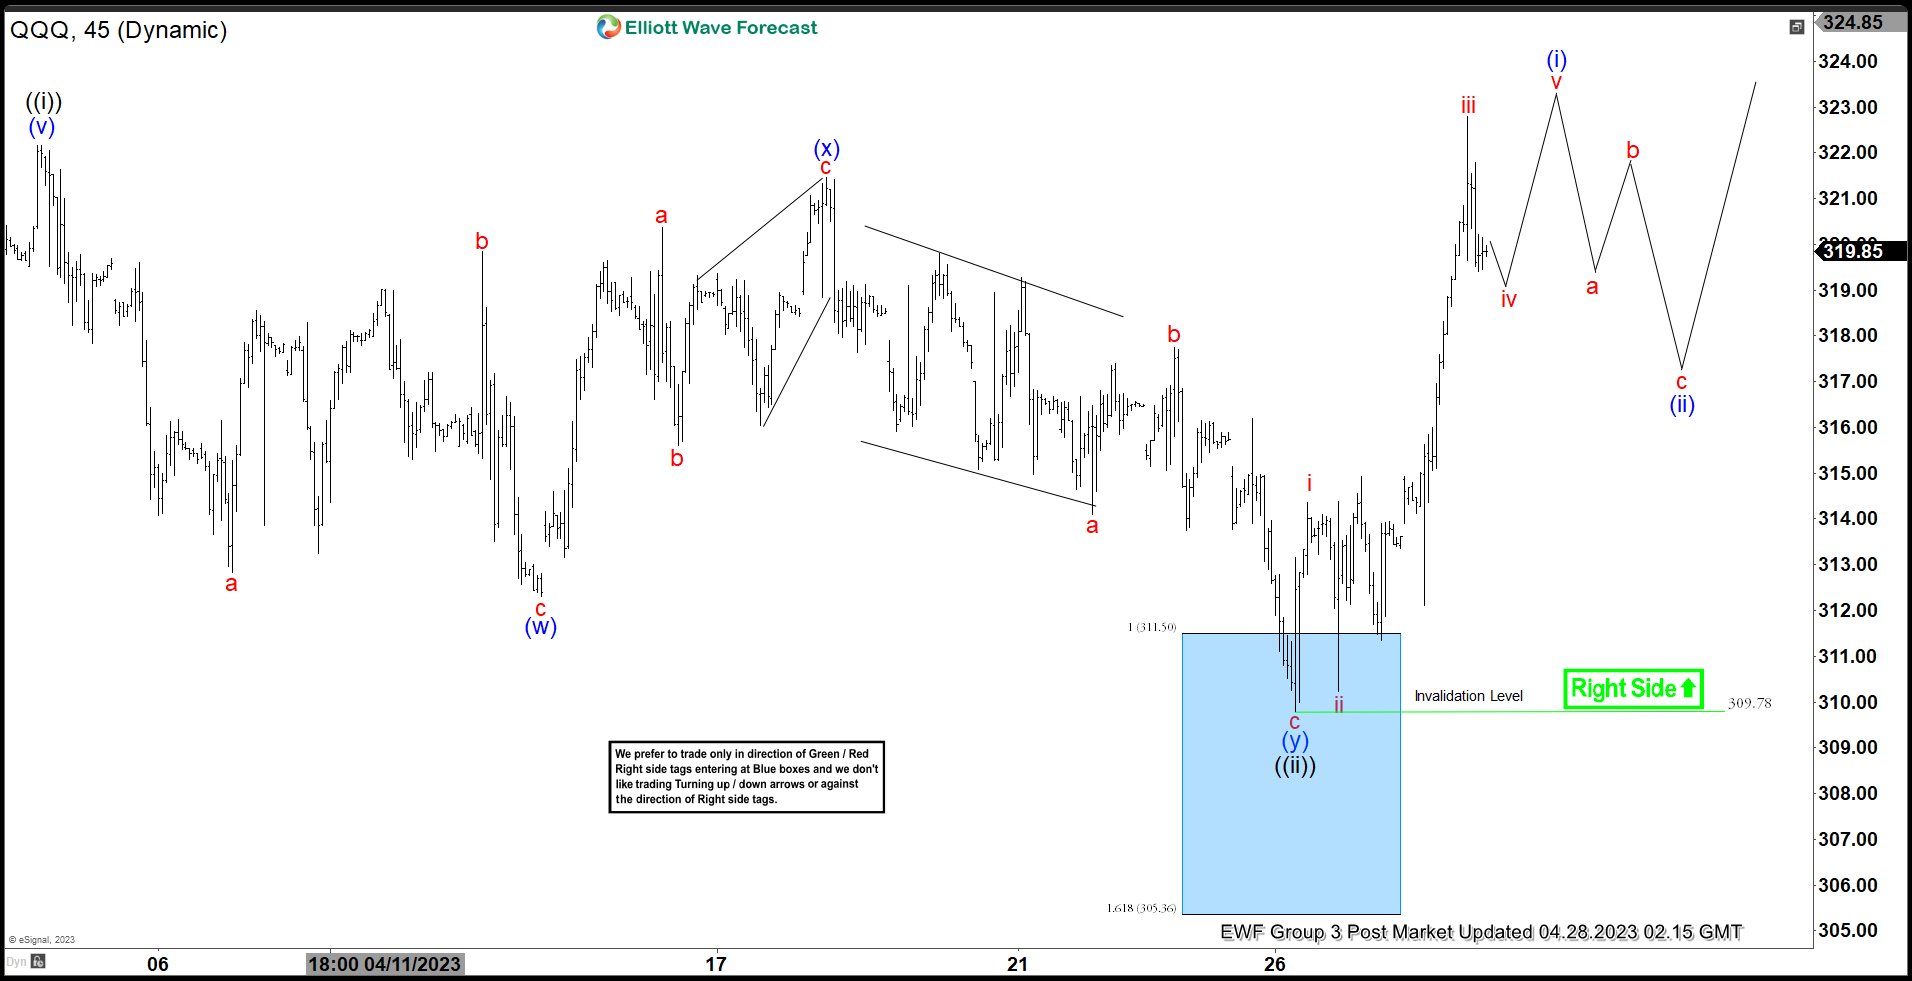
Cycle from 3.13.2023 low in QQQ ended in wave ((i)) at 322.16 as the 45 minutes chart below shows. The ETF then corrected in wave ((ii)) which has also ended at 309.78. Internal subdivision of wave ((ii)) unfolded as a double three Elliott Wave structure. Down from wave ((i)), wave a ended at 312.82 and rally in wave b ended at 319.85. ETF extended lower in wave c towards 312.30 which ended wave (w) in higher degree. Rally in wave (x) ended at 321.46 with internal subdivision as a zigzag structure. Up from wave (w), wave a ended at 320.36 and wave b dips ended at 315.61. Wave c higher ended at 321.46 which completed wave (x).
Down from wave (x), wave a ended at 314.10, wave b ended at 317.74, and wave c lower ended at 309.78 which completed wave (y) of ((ii)) in higher degree. QQQ has since resumed higher and broken above wave ((i)) suggesting the next leg higher has started. Up from wave ((ii)), wave i ended at 314.37 and pullback in wave ii ended at 310.22. The ETF extended higher in wave iii towards 322.80. Expect wave iv pullback to end and the ETF extends higher again in wave v to complete wave (i). Afterwards, it should pullback in wave (ii) to correct cycle from 4.26.2023 low in 3, 7, or 11 swing before it resumes higher.


