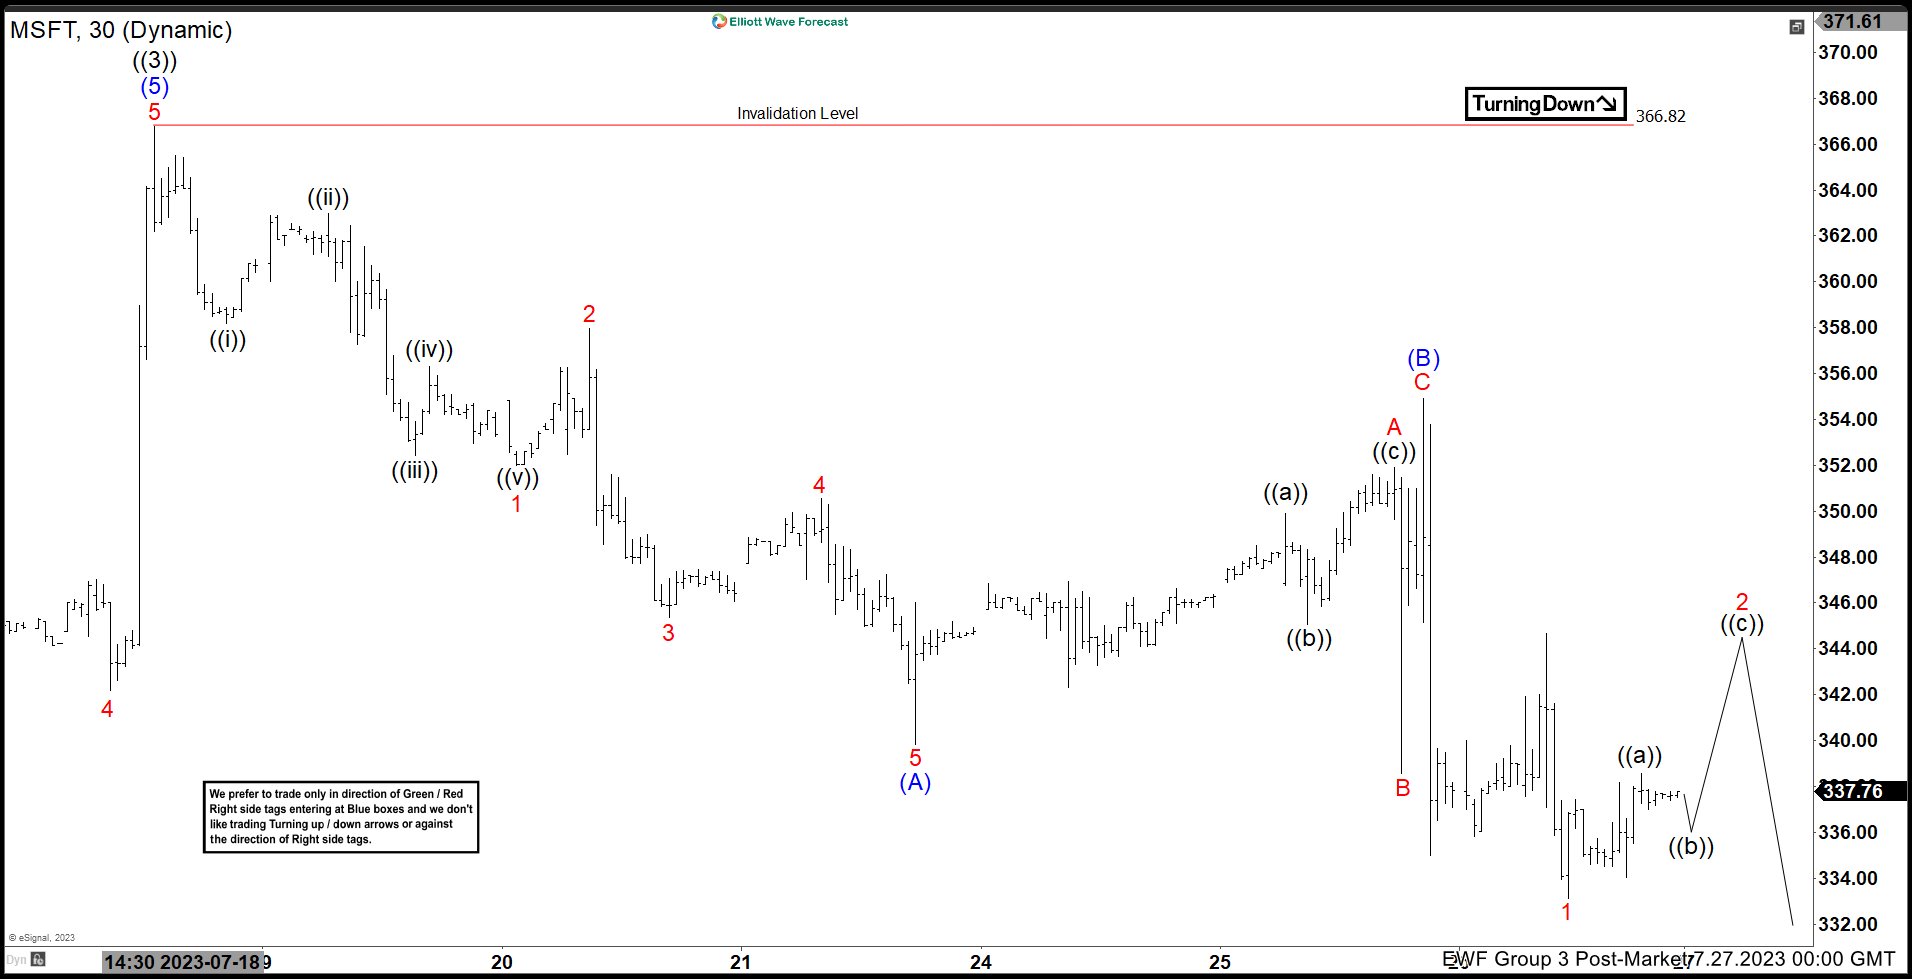
Rally in Microsoft (ticker: MSFT) from the 11.4.2022 low is unfolding as a 5 waves impulse Elliott Wave structure. Up from 11.4.2022 low, wave ((1)) ended at 263.92 and pullback in wave ((2)) ended at 219.35. The stock rallies again in wave ((3)) which ended at 366.82 as the 30 minutes chart below shows. Wave ((4)) pullback is currently in progress as a zigzag Elliott Wave structure. Down from wave ((3)), wave 1 ended at 352.01 and rally in wave 2 ended at 357.97. The stock resumes lower in wave 3 towards 345.37 and wave 4 ended at 350.56. Final leg wave 5 ended at 339.83 which completed wave (A).
Rally in wave (B) ended at 354.9 with internal subdivision as an expanded flat. Up from wave (A), wave ((a)) ended at 349.9, wave ((b)) ended at 345.07, and wave ((c)) ended at 351.89. This completed wave A of (B) in higher degree. Pullback in wave B ended at 338.56 and rally in wave C ended at 354.90 which completed wave (B). The stock now has resumed lower in wave (C). Down from wave (B), wave 1 ended at 333.11. Wave 2 rally is in progress as a zigzag to correct the decline from wave (B). Expect wave 2 rally to fail below wave (B) high at 354.9 and the stock to reesume lower. As far as pivot at 366.82 high stays intact, rally should fail in 3, 7, or 11 swing for further downside.


