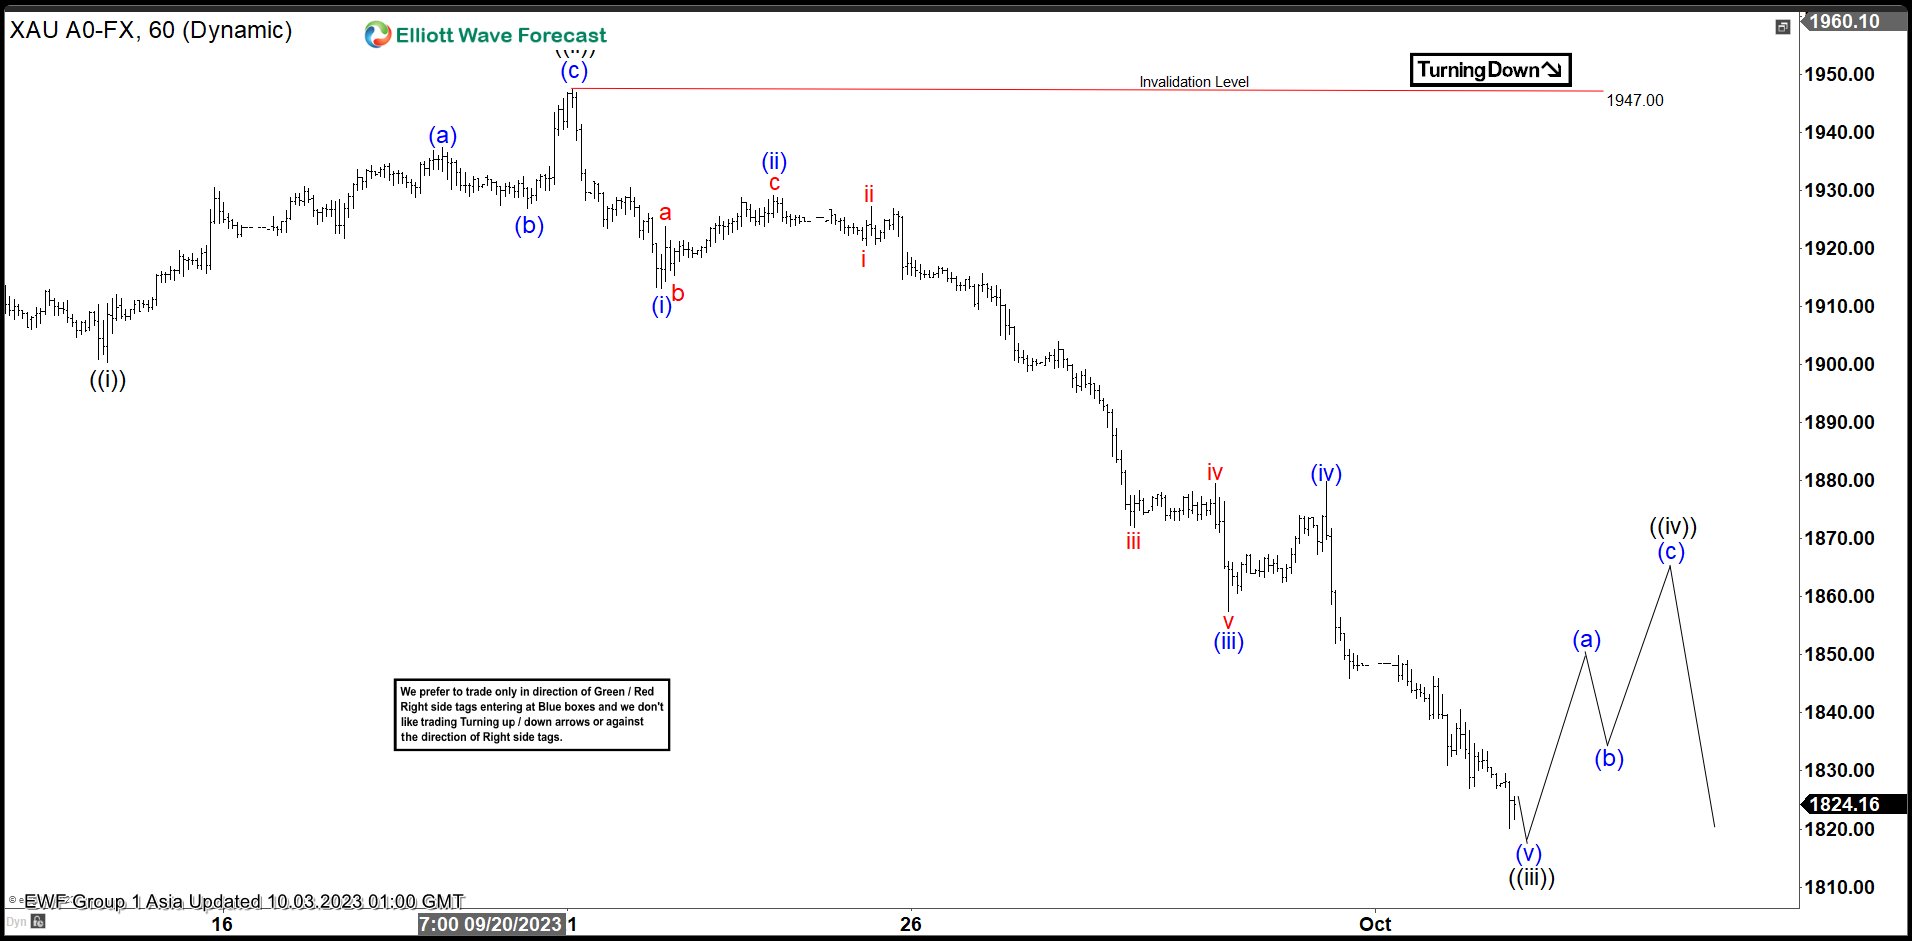
Gold shows incomplete bearish sequence from 5.4.2023 high favoring further downside. Down from 5.4.2023 high, wave (W) ended at 1898.12 and wave (X) rally ended at 1987.42. Gold then resumed lower in wave (Y) with internal subdivision as a zigzag Elliott Wave structure. Down from wave (X), wave A ended at 1884.89 low and wave B ended at 1952.95 high on September 1. Wave C lower is in progress as a 5 waves impulse structure. Down from wave B, wave ((i)) ended at 1901.11 and wave ((ii)) rally ended at 1947.39.
Wave ((iii)) lower is in progress as a 5 waves impulse in lesser degree. Down from wave ((ii)), wave (i) ended at 1913 and rally in wave (ii) ended at 1929.12. Wave (iii) lower ended at 1857.40 and rally in wave (iv) ended at 1879.81. Expect wave (v) to end soon which should complete wave ((iii)). Afterwards, expect rally in wave ((iv)) to correct cycle from 9.21.2023 high in 3, 7, or 11 swing before the decline resumes. Near term, as far as pivot at 1947 high stays intact, expect rally to fail in 3, 7, or 11 swing for further downside.


