In this Chart of the Day, we have explained that Gold has reached the biggest extreme from 2015 lows by reaching our target area at $1450. However, Gold is calling for another push higher in biggest time frame charts still but near-term cycles are calling for a pullback to reset before another push higher takes place. Now let’s take a look at the shorter cycles & look at Elliott wave structures below:
Gold 1 Hour Elliott Wave Chart
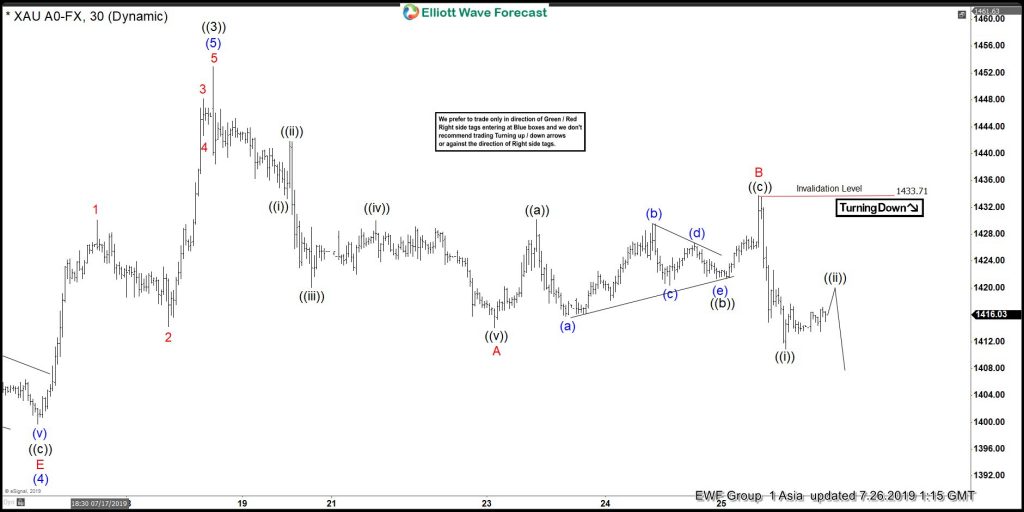
Gold 1 hour Elliott wave Chart from Asia update, in which a pullback to $1389.82 low ended the wave (4) pullback. Up from there, a rally to $1452.95 high ended wave (5), which also completed a bigger wave ((3)). Down from there, the wave ((4)) pullback is taking place in 3, 7 or 11 swings to correct the rally from 4/23/2019 low (1265). While the pullback from the peak is taking place as a zigzag structure where wave ((i)) ended at $1433.30 low. Wave ((ii)) ended at $1441.85 high, wave ((iii)) ended at $1423.60 low, wave ((iv)) bounce ended at $1430.02 high and wave ((v)) ended at $1416.88 low, which also completed wave A lower.
Up from there, wave B bounce unfolded as a lesser degree zigzag structure where wave ((a)) ended at $1430.23 high. Wave ((b)) ended at $1421.40 low and wave ((c)) ended at $1433.71 high. Down from there, wave C remains in progress in another 5 waves structure looking for more downside towards $1395.36-$1385.67 100%-123.6% Fibonacci extension area of A-B. Then from there, Gold will determine either if it’s going to rally for new highs in wave ((5)) or just do a 3 wave bounce and fail again to do the double correction lower. We don’t like selling it and expect buyers to appear again in wave ((4)) pullback at the later stage of the market.


