Gold higher time frame cycles suggest that cycle from 8/16/2018 low ended 5 waves advance on February 20, 2019, at $1346.75 high. Since then, Gold is going lower in an impulse manner as the decline is unfolding as Elliott wave zigzag structure. It’s important to note that the cycle from 2/20/2019 peak remains incomplete to the downside therefore, further downside is expected. Looking for more downside towards $1258.18-1242.45 100%-123.6% Fibonacci extension area of Minor A-B before finding support.
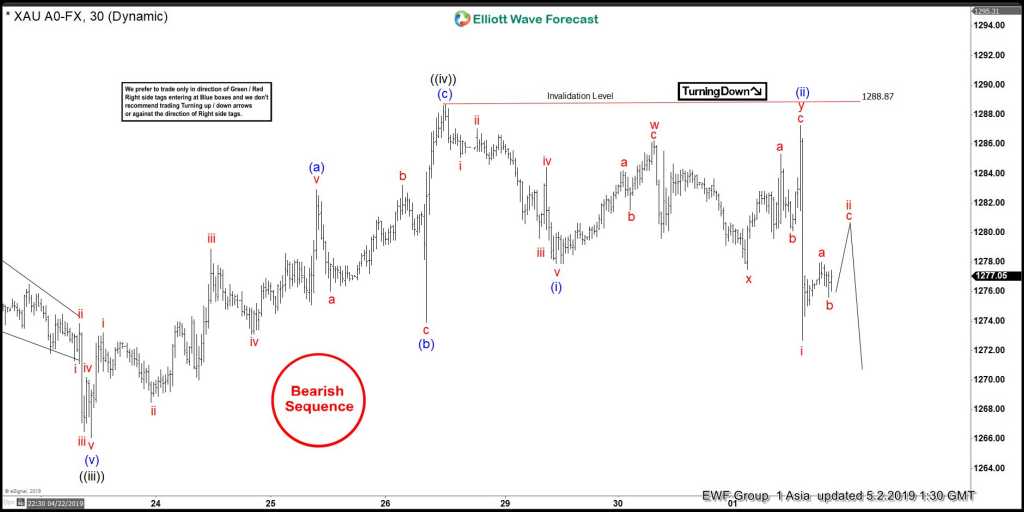
The internals of wave C is unfolding as ending diagonal structure where wave ((i)) ended at $1280.70. Wave ((ii)) ended at $1310.60 high, wave ((iii)) ended at $1266.10 low and wave ((iv)) ended with an overlap in wave ((i)) at $1288.87 high. Down from there, the decline can be nesting lower as impulse structure where Minutte wave (i) ended at $1277.90. Minutte wave (ii) ended at $1287.26 high and now Minutte wave (iii) taking place looking for more downside.
Or another possibility is that, if it manages to take out $1272.70 Subminutte wave i, then it can be ending 5 waves decline from 4/26/2019 peak ( $1288.87) in Minutte wave (i). Then 3 wave bounce can take place against $1288.87 high in Minutte wave (ii) before further downside take place. We do not like buying Gold in the shorter cycle and still favor more downside as far as pivot at $1288.87 remains intact.
Gold 1 Hour Elliott Wave Chart
1 hour Gold Elliott Wave Video
Back


