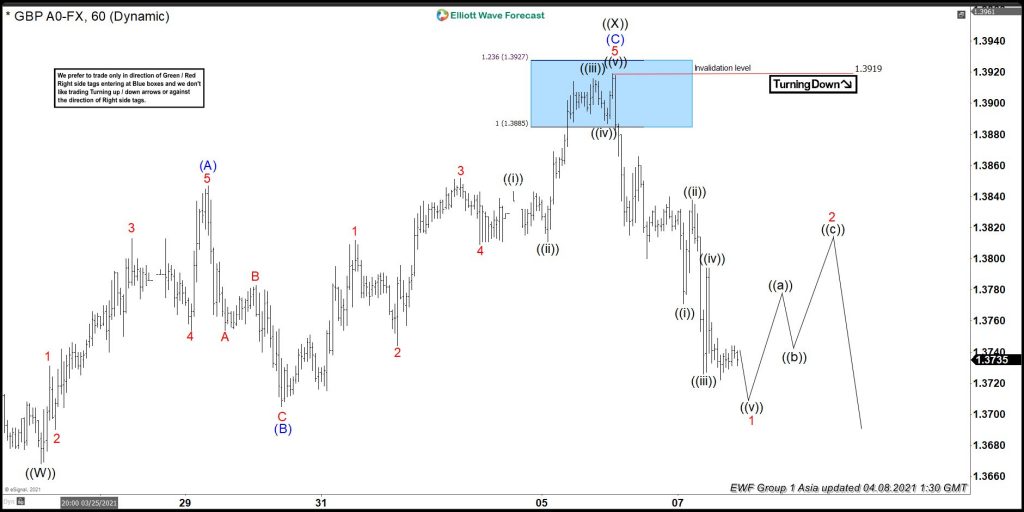
Short term Elliott wave view in GBPUSD suggests that the cycle from February 24, 2021 peak is unfolding as a double three structure. While the initial decline to March 25, 2021 low ended wave ((W)) at $1.3668 low. Up from there, the pair made a recovery in wave ((X)) bounce to correct the cycle from the 2/24/2021 peak. The internals of that bounce unfolded as Elliott wave zigzag structure where wave 1 of (A) ended at $1.3731 high. Wave 2 ended at $1.3690 low, wave 3 ended at $1.3813 high, wave 4 ended at $1.3754 low, and wave 5 ended at $1.3847 high thus completed the first leg of the bounce in wave (A).
Down from there, the pair made a 3 wave pullback within wave (B) as a lesser degree zigzag structure where wave A ended at $1.3754 low. Wave B ended at 1.3783 high and wave C ended at $1.3705 low. Then the pair started the (C) leg higher as an ending diagonal structure where wave 1 ended at $1.3812 high. Wave 2 ended at $1.3744 high, wave 3 ended at $1.3852 high, wave 4 ended at $1.3809. And wave 5 ended at $1.3919 high after reaching the 100%-123.6% Fibonacci extension area of (A)-(B) at $1.3885- $1.3927 area. From where the pair saw sellers as expected & saw the minimum reaction lower. Near-term, as far as bounces fail below $1.3919 high then the pair is expected to resume lower. However, a clear break below $1.3668 prior wave ((W)) still needed to confirm the next extension lower & avoid double correction higher.


