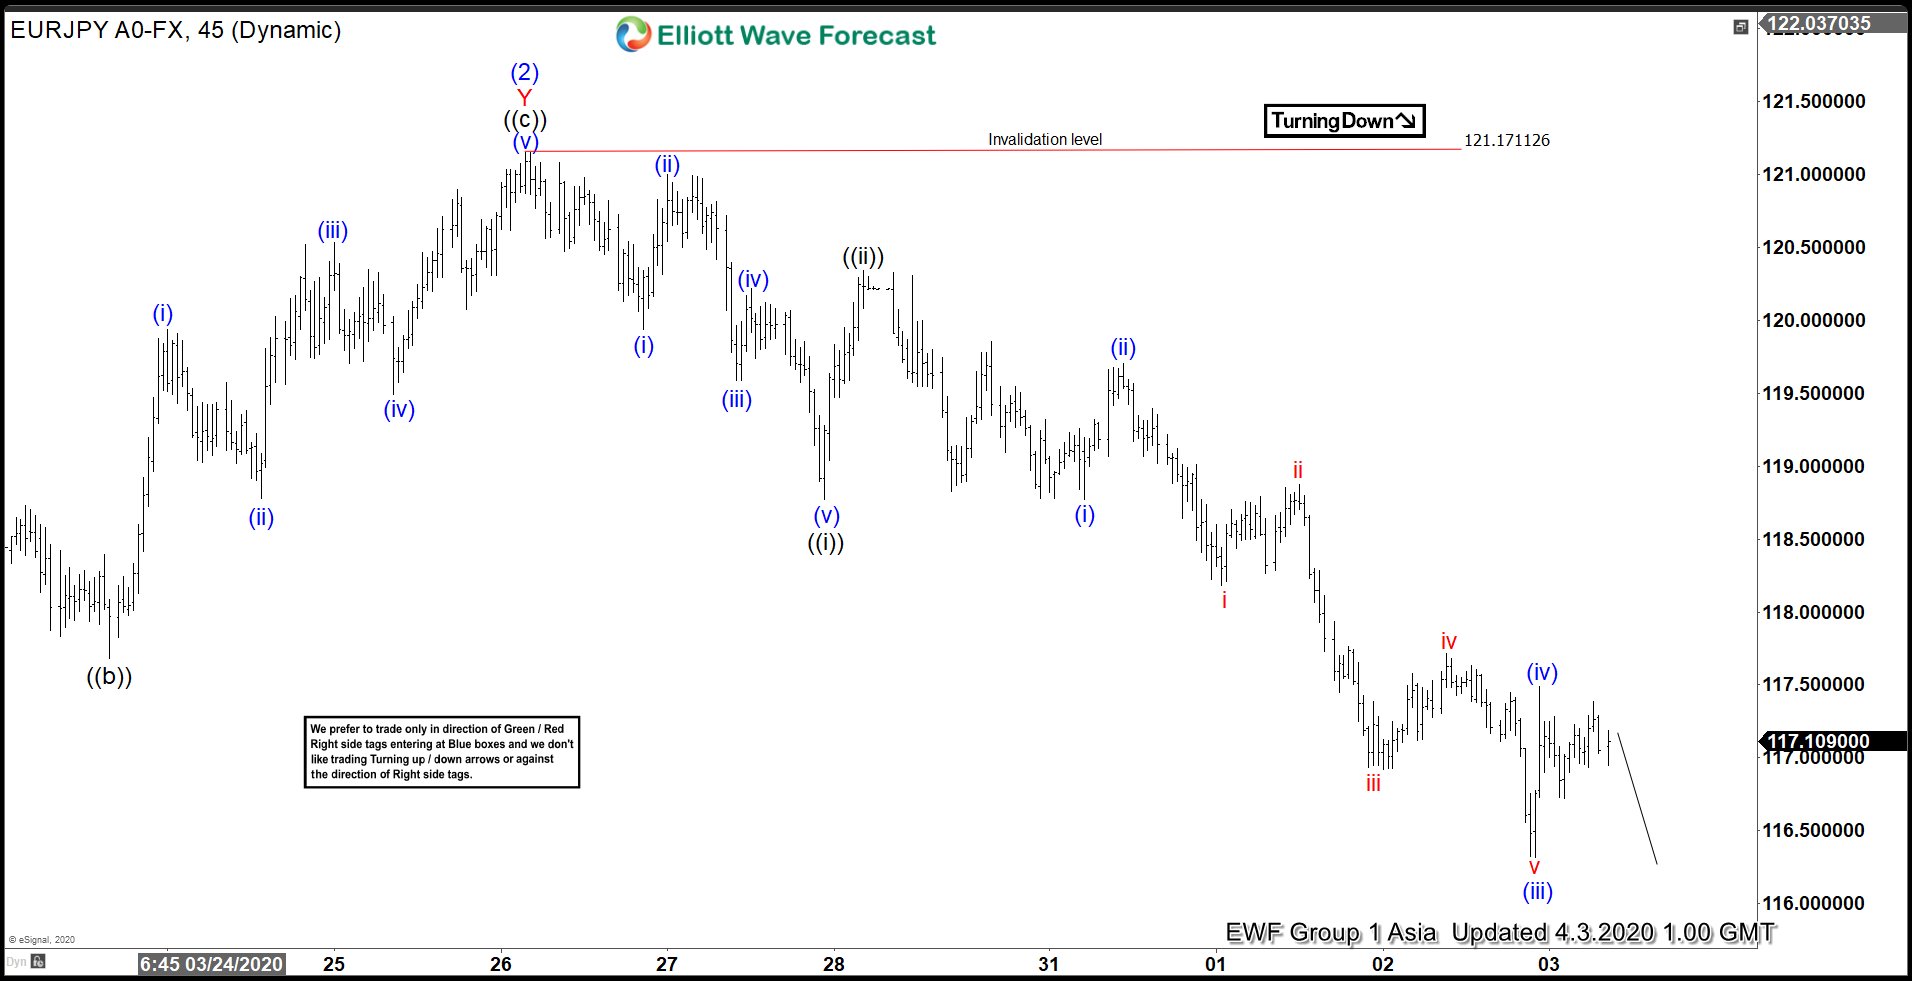
Short term Elliott Wave view in EURJPY suggests the decline from January 14, 2020 high is unfolding as a 5 waves impulse structure. Down from Jan 14 high, wave (1) ended at 116.13 and wave (2) bounce ended at 121.15. Pair is proposed to have resumed lower in wave (3), although pair still needs to break below wave (1) at 116.13 to validate the view.
Down from wave (2) high a 121.17, wave ((i)) ended at 118.77 as 5 waves and wave ((ii)) bounce ended at 120.34. Wave ((iii)) remains in progress as 5 waves with extension. Wave (i) of ((iii)) ended at 118.77, and wave (ii) of ((iii)) ended at 119.7. Pair extended lower in wave (iii) of ((iii)) towards 116.31, and wave (iv) of ((iii)) ended at 117.49.
Near term, expect pair to extend lower in wave (v) of ((iii)). Afterwards, it should bounce in wave ((iv)) before the final leg lower in wave ((v)) of 1. As far as the rally fails below 121.17, expect pair to extend lower. Potential target lower is 100% – 123.5% Fibonacci extension from January 14, 2020 high which comes at 112.71 – 114.32.
EURJPY 1 Hour Elliott Wave Chart


