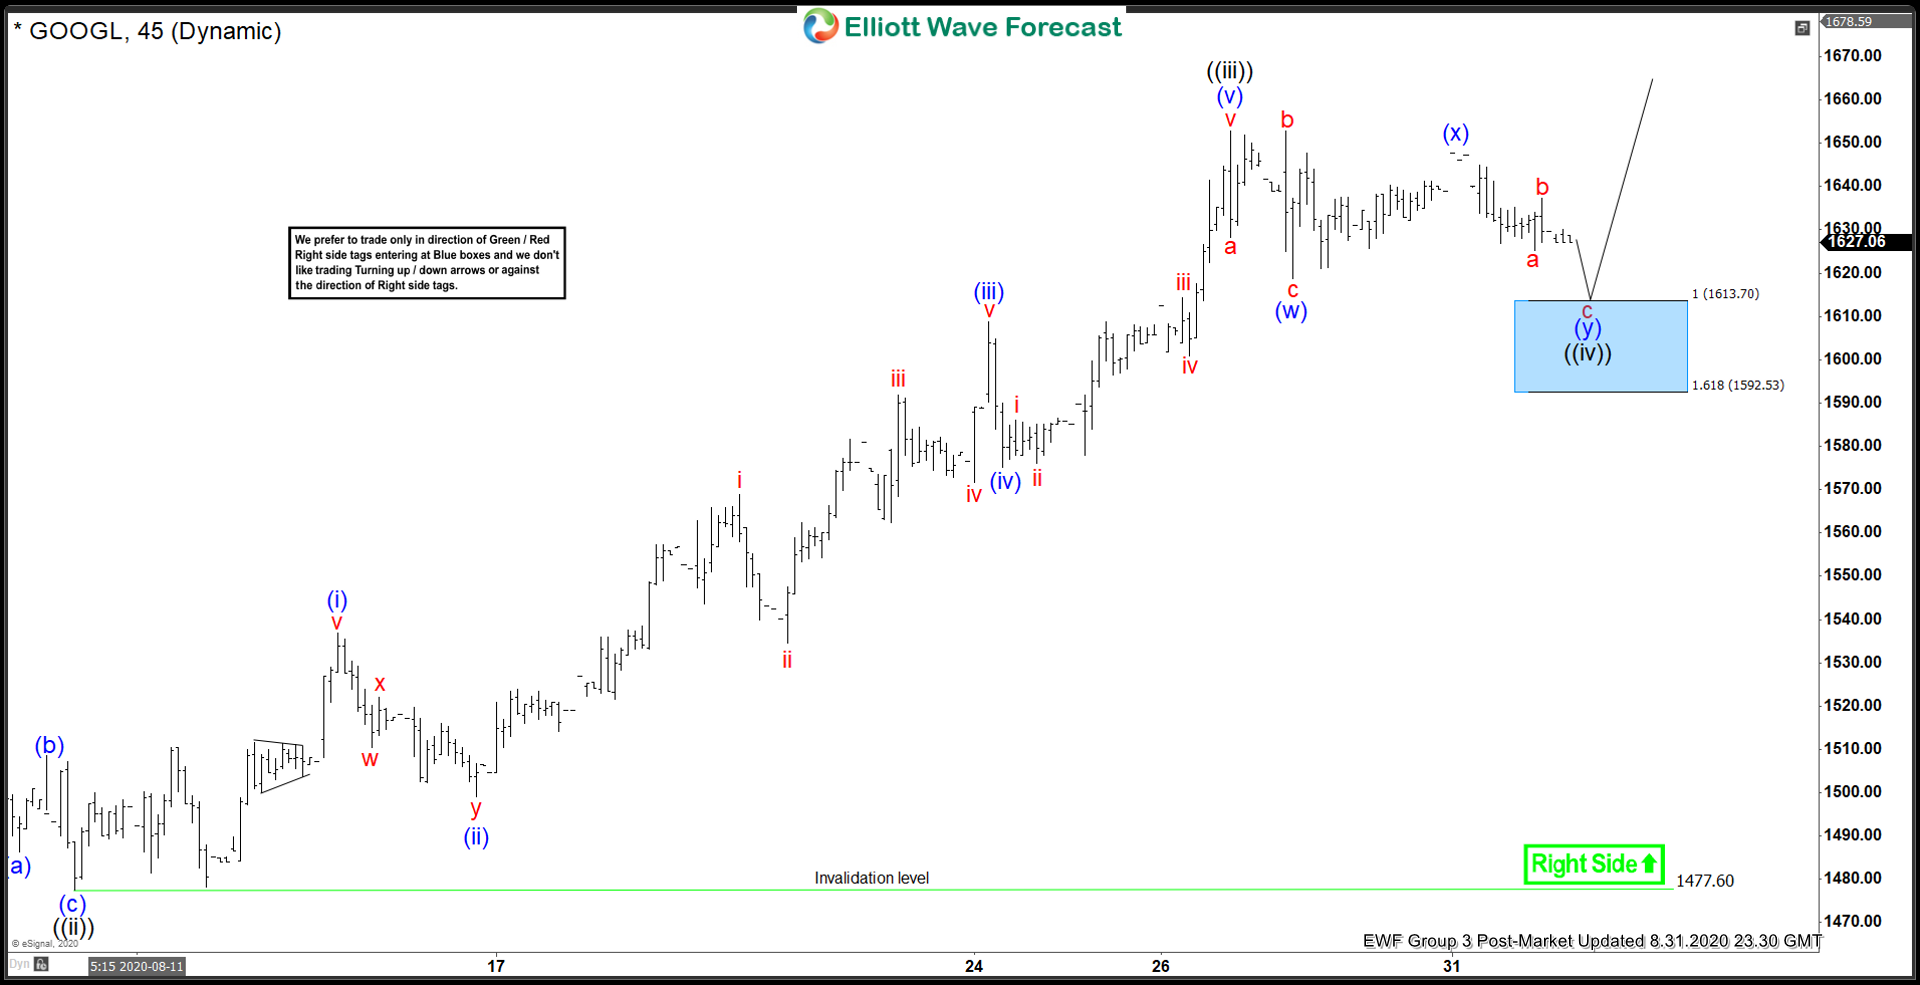
Alphabet (GOOGL) 45 minutes chart below shows that the stock has rallied higher from August 10 low. From that low, the stock rallied higher in wave ((iii)), which ended at 1652.79 high. The rally unfolded as a 5 waves impulsive Elliott Wave Structure. Up from wave ((ii)) low, wave (i) ended at 1536.97 high. The dip in wave (ii) ended at 1499 low. The stock then extended higher in wave (iii), which ended at 1608.78 high. Wave (iv) pullback then ended at 1575.04 low. The push higher in wave (v) ended at 1652.79 high. This completed wave ((iii)) in larger degree.
Currently, the stock is doing a pullback in wave ((iv)) to correct the cycle from August 10 low. The structure is unfolding as a double correction. Wave (w) ended at 1618.81 low. The bounce in wave (x) ended at 1647.79 high. Wave (y) lower is in progress. The 100-161.8% extension of wave (w)-(x) where (y) can potentially end is at 1592.53 – 1613.70 area, highlighted with a blue box. If reached, that area can produce 3 waves bounce at least or the stock can resume higher in wave ((v)). The 100% extension from June 29 low, where wave ((v)) could target is at 1689.


