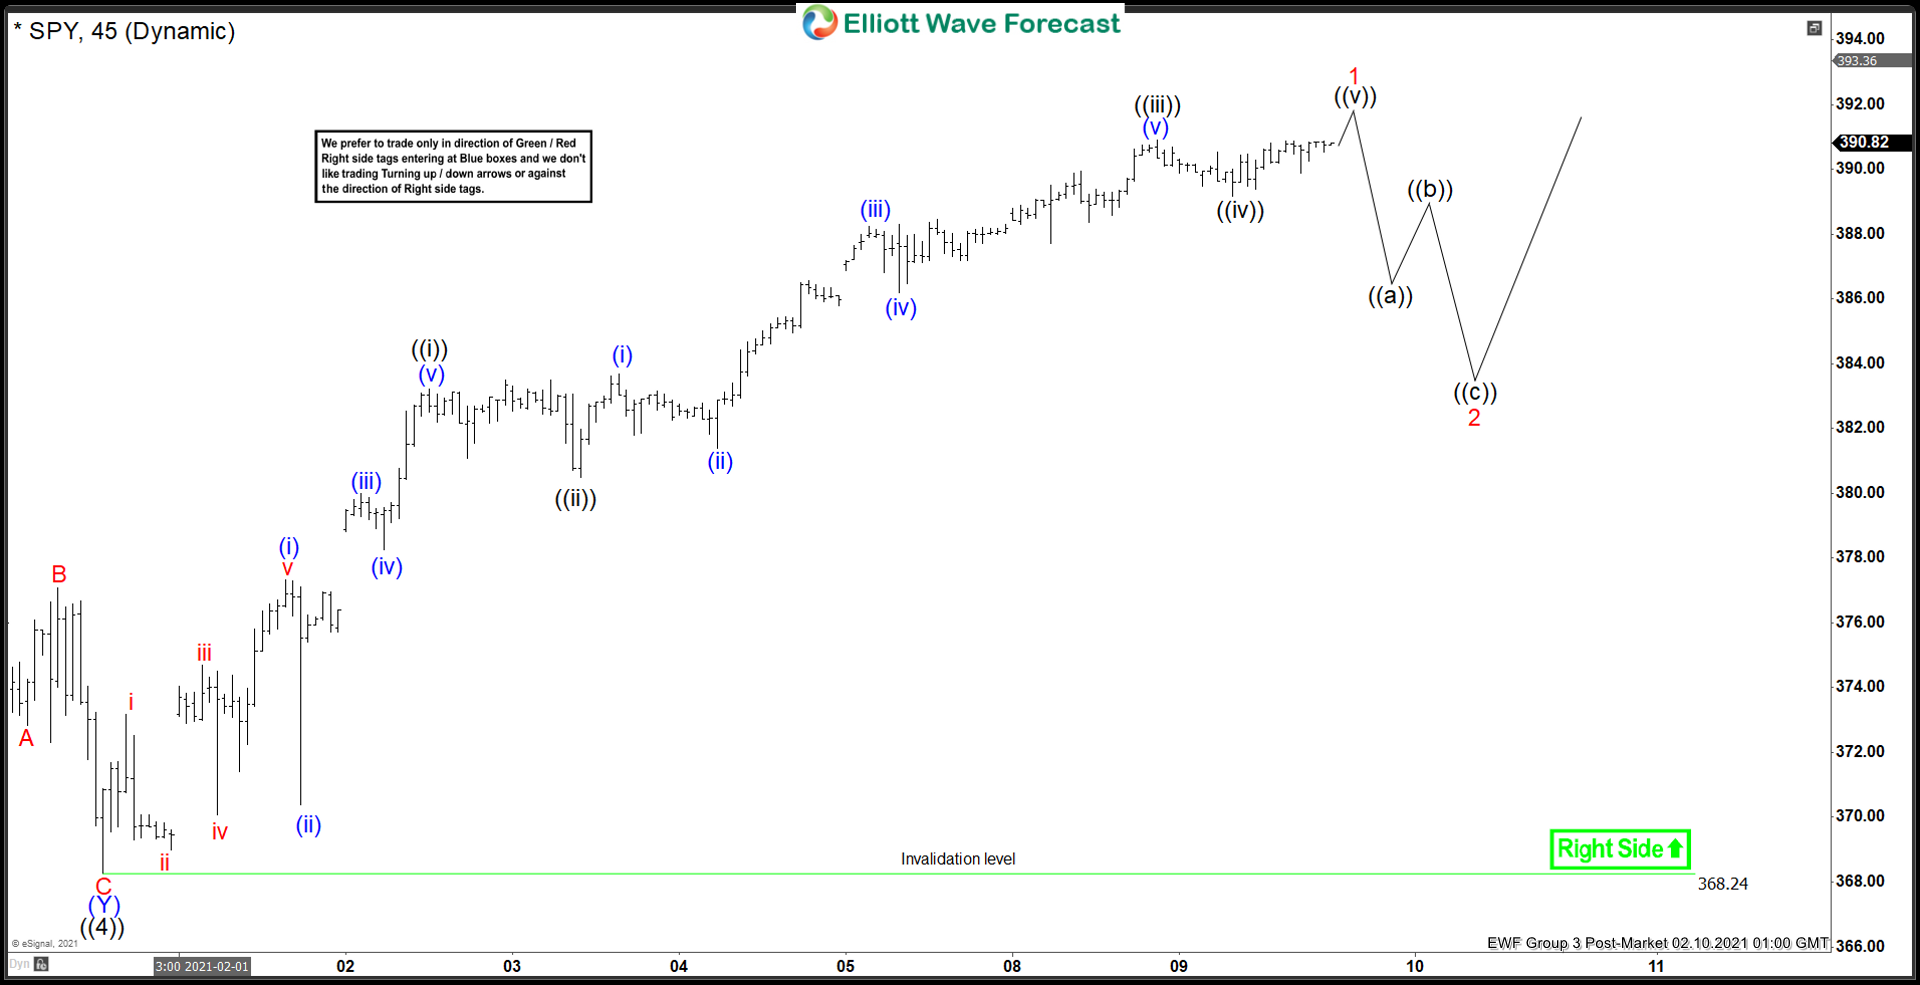
Since bottoming on March 2020, S&P 500 ETF (SPY) continues to make a new high, suggesting the trend and cycle remain bullish. Entire rally from March 2020 low is unfolding as a 5 waves impulse Elliott Wave structure. In the short term 45 minutes chart below, we can see wave ((4)) of this impulse ended at 368.24. The ETF has since extended higher in wave ((5)). Internal of wave ((5)) is unfolding as another impulse in lesser degree.
Up from wave ((4)) low, wave ((i)) ended at 383.22, and dips in wave ((ii)) ended at 380.48. The ETF then resumed higher in wave ((iii)) towards 390.9 and pullback in wave ((iv)) ended at 389.17. Expect SPY to end wave ((v)) soon and this should complete wave 1 in larger degree. The ETF should then pullback in wave 2 to correct the cycle from January 30, 2021 low before the rally resumes again. The internal subdivision of wave 2 is proposed to be unfolding as a 3 waves zigzag structure ((a))-((b))-((c)). As far as January 30 pivot low at 368.24 stays intact, expect dips to find support in 3, 7, or 11 swing for more upside.


