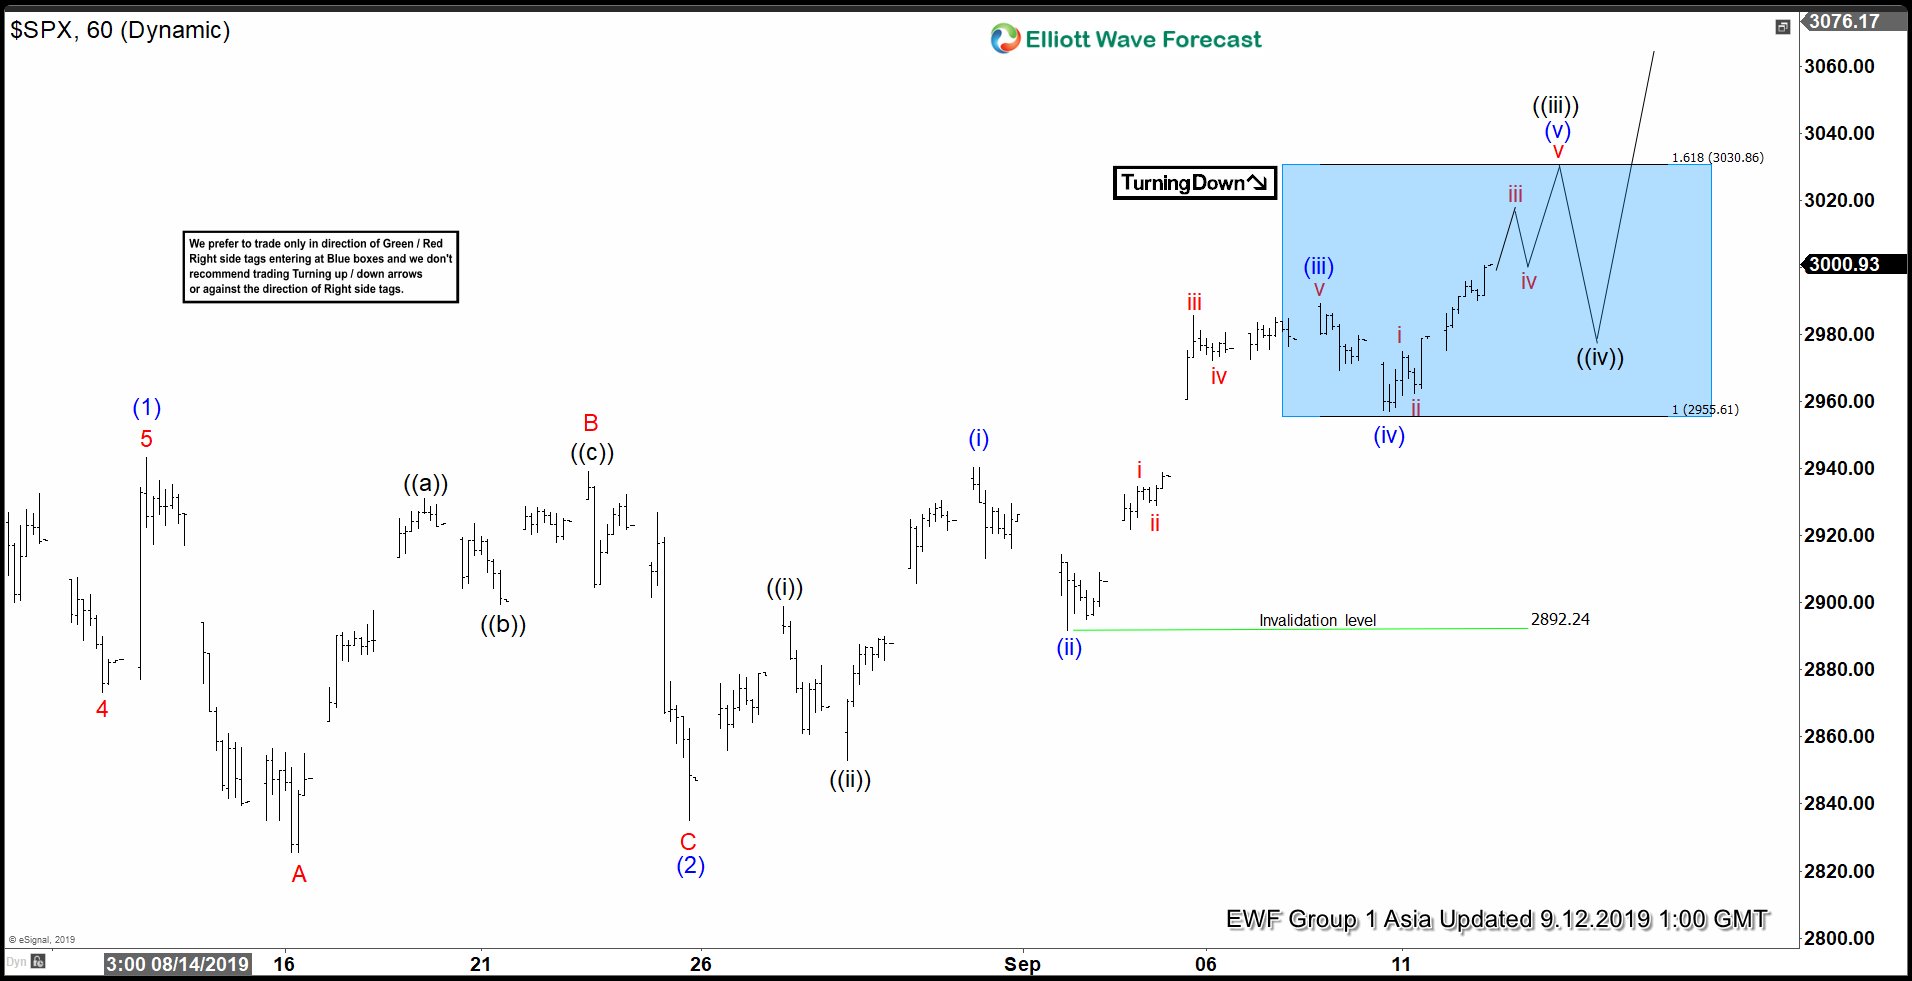
Short term Elliott Wave view suggests the rally in S&P 500 (SPX) from August 6, 2019 low is unfolding as an impulse Elliott Wave structure. In the chart below, we can see wave (1) ended at 2943.31 and wave (2) pullback ended at 2834.97. Internal subdivision of wave (2) unfolded as a running Flat. Wave A ended at 2825.51, wave B ended at 2939.08 and wave C of (2) ended at 2834.97. Wave (3) is currently in progress and expected to eventually make a new all-time high.
Up from 2834.97, wave ((i)) ended at 2898.79 and wave ((ii)) ended at 2853.05. Wave ((iii)) remains in progress and it is unfolding as an impulse Elliott Wave structure in lesser degree. Expect wave ((iii)) to end soon and Index should then pullback in wave ((iv)) before 1 more push higher to end wave ((v)) of 1. We don’t like selling the Index and continue to see near-term support in any dips in 3, 7 ,or 11 swing for further upside.


