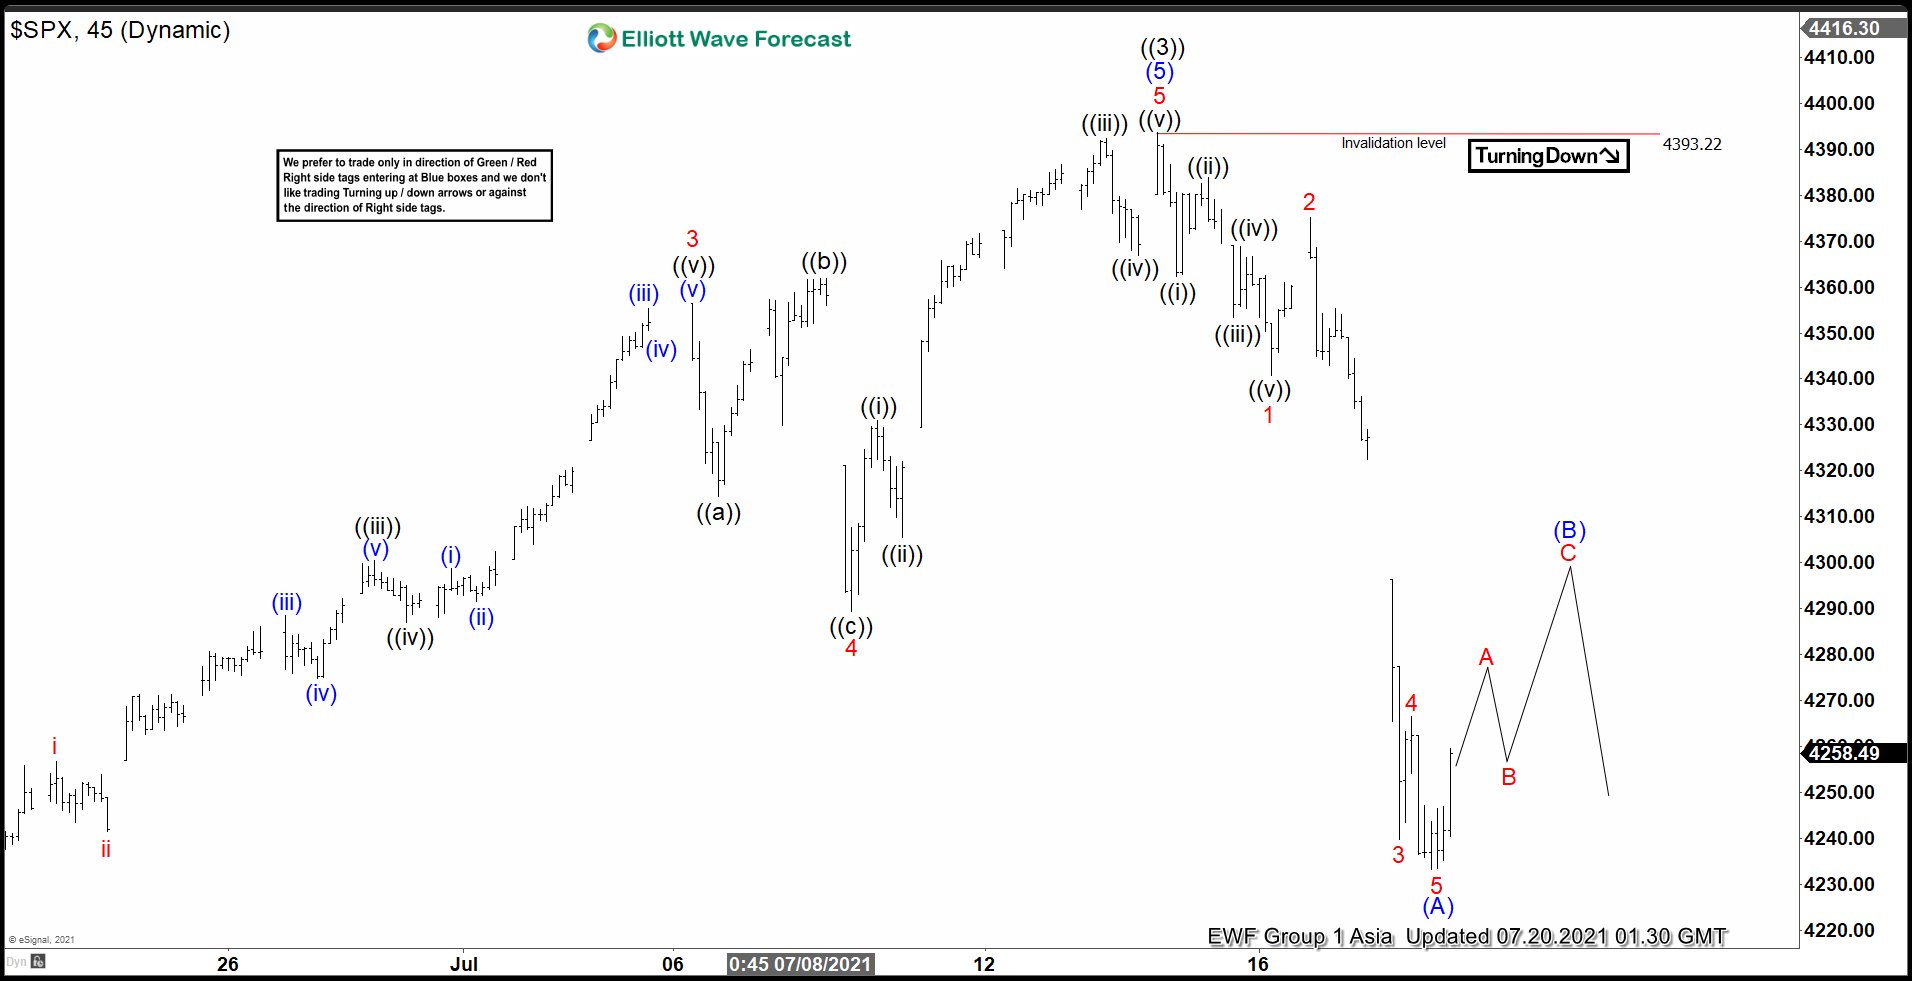
Since forming the bottom on March 2020 low, S&P 500 ($SPX) has started a new bullish cycle which brings the Index to all-time high. The entire rally from March 2020 low can be counted as 3 waves so far. Up from March 23, 2020 low, wave ((1)) ended at 3588.11 and pullback in wave ((2)) ended at 3209.45. Index then resumes higher and ended wave ((3)) at 4393.22 as the 45 minutes chart below shows.
Wave ((4)) pullback is currently in progress to correct cycle from September 24, 2020 low in 3, 7, or 11 swing before the rally resumes. The pullback is proposed to be unfolding as a zigzag Elliott Wave structure. Down from wave ((3)), wave 1 ended at 4340.70 and rally in wave 2 ended at 4375.09. Index resumes lower in wave 3 towards 4239.82 and bounce in wave 4 ended at 4266.56. Final leg lower wave 5 ended at 4233.13. This completed wave (A) in higher degree. Wave (B) is now in progress to correct the decline from July 14 peak in 3, 7, or 11 swing before Index turns lower again. Near term, as far as July 14 high pivot remains intact, expect short term rally to fail in 3, 7, or 11 swing for further downside.


