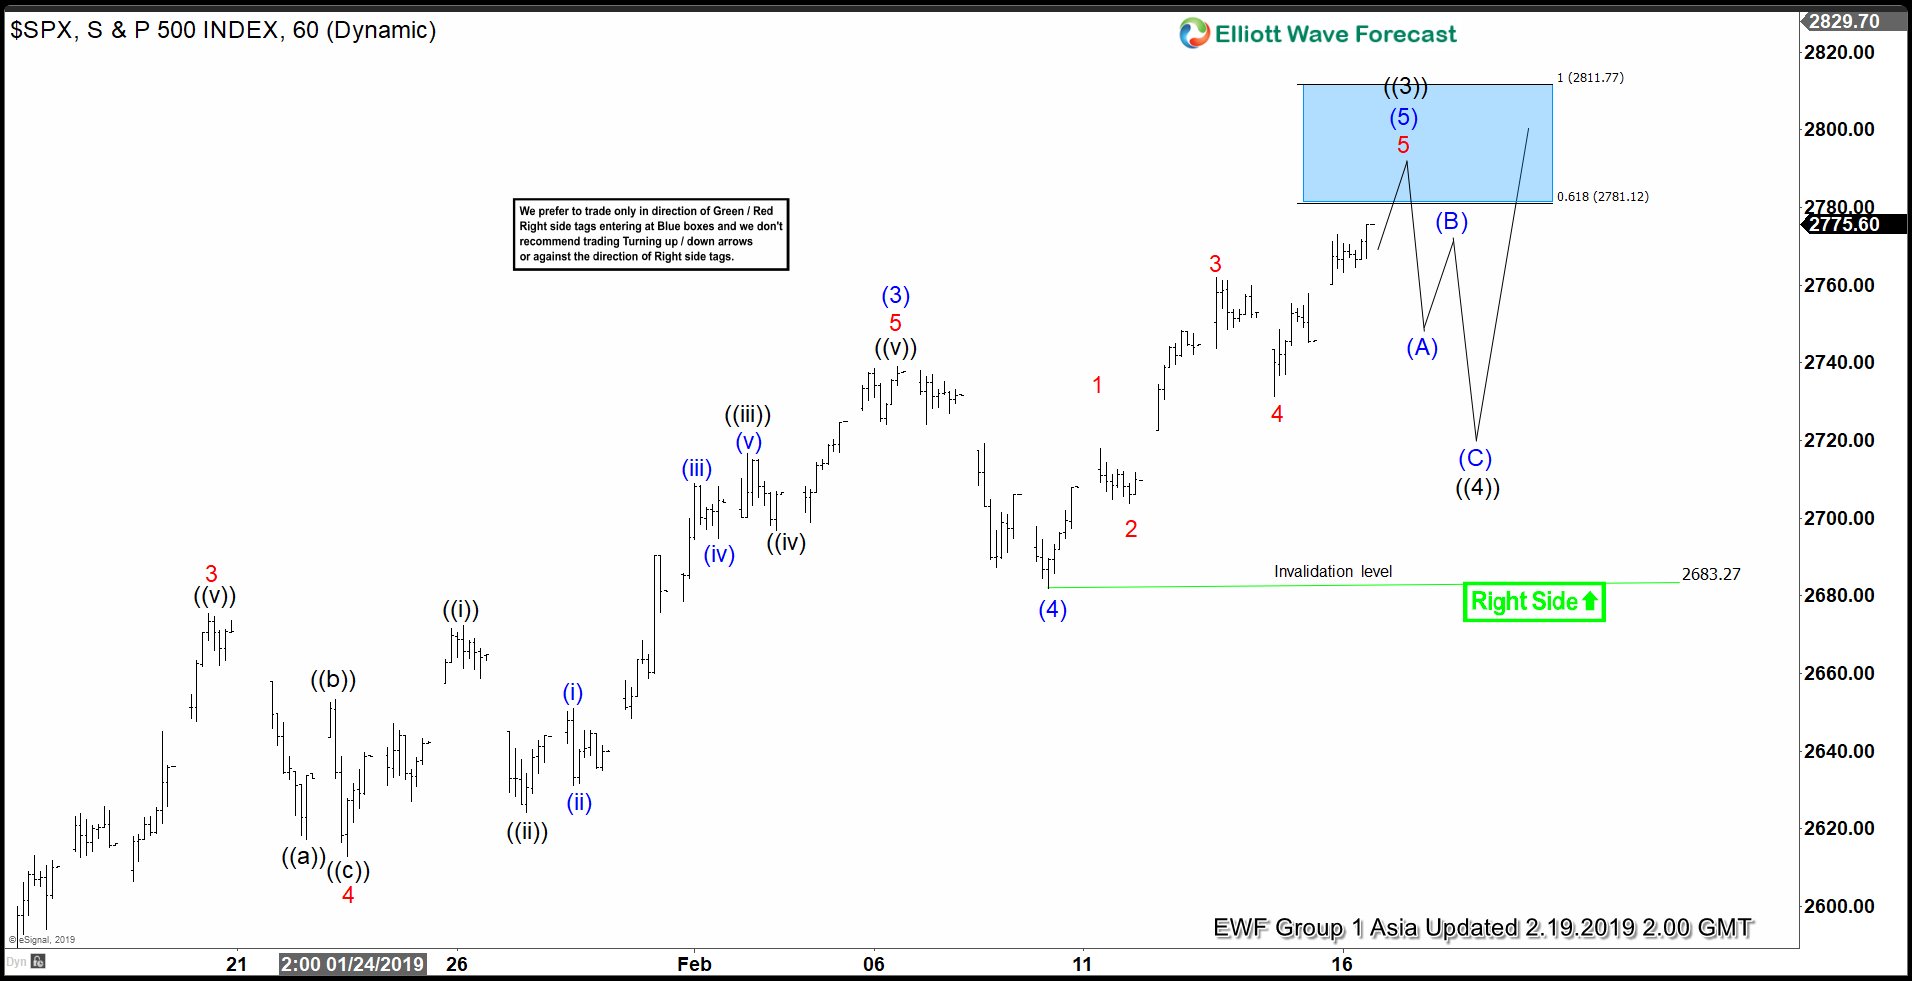
Since bottoming at 2346.58 on December 26, 2018, S&P 500 (SPX) has rallied 18% in less than 2 months. The structure of the rally appears like an Impulse Elliott Wave structure. An Impulse structure is a 5 waves move. The Index is now within wave ((3)) of the possible 5 waves move from December 26 low. Subdivision of wave ((3)) unfolded as another 5 waves of lower degree where wave (3) ended at 2738.98 and wave (4) ended at 2681.83.
Wave (5) of ((3)) is currently in progress towards a potential target of 2781.12 – 2811.77 (blue box). The Index should then pullback in wave ((4)) to correct wave ((3)) rally from December 28, 2018 low (2397.94). The pullback should later unfold and find buyers in the sequence of 3, 7, or 11 swing. In Elliott Wave Theory, wave 4 typically correct wave 3 at 23.6 – 38.2 Fibonacci retracement. We need to wait for wave ((3)) to complete before we can project a more accurate retracement area. If we assume wave ((3)) ends at 2781 (the blue box), then potential area for the Index to end the wave ((4)) correction is approximately 2635 – 2691.
Once the Index ends the correction, it still has a chance to extend higher 1 more leg in wave ((5)). Alternate view suggests that the Index ends wave ((5)) already in the current rally instead of wave ((3)). In the alternate view, Index should correct the entire rally from December 26, 2018 low in the next pullback.


