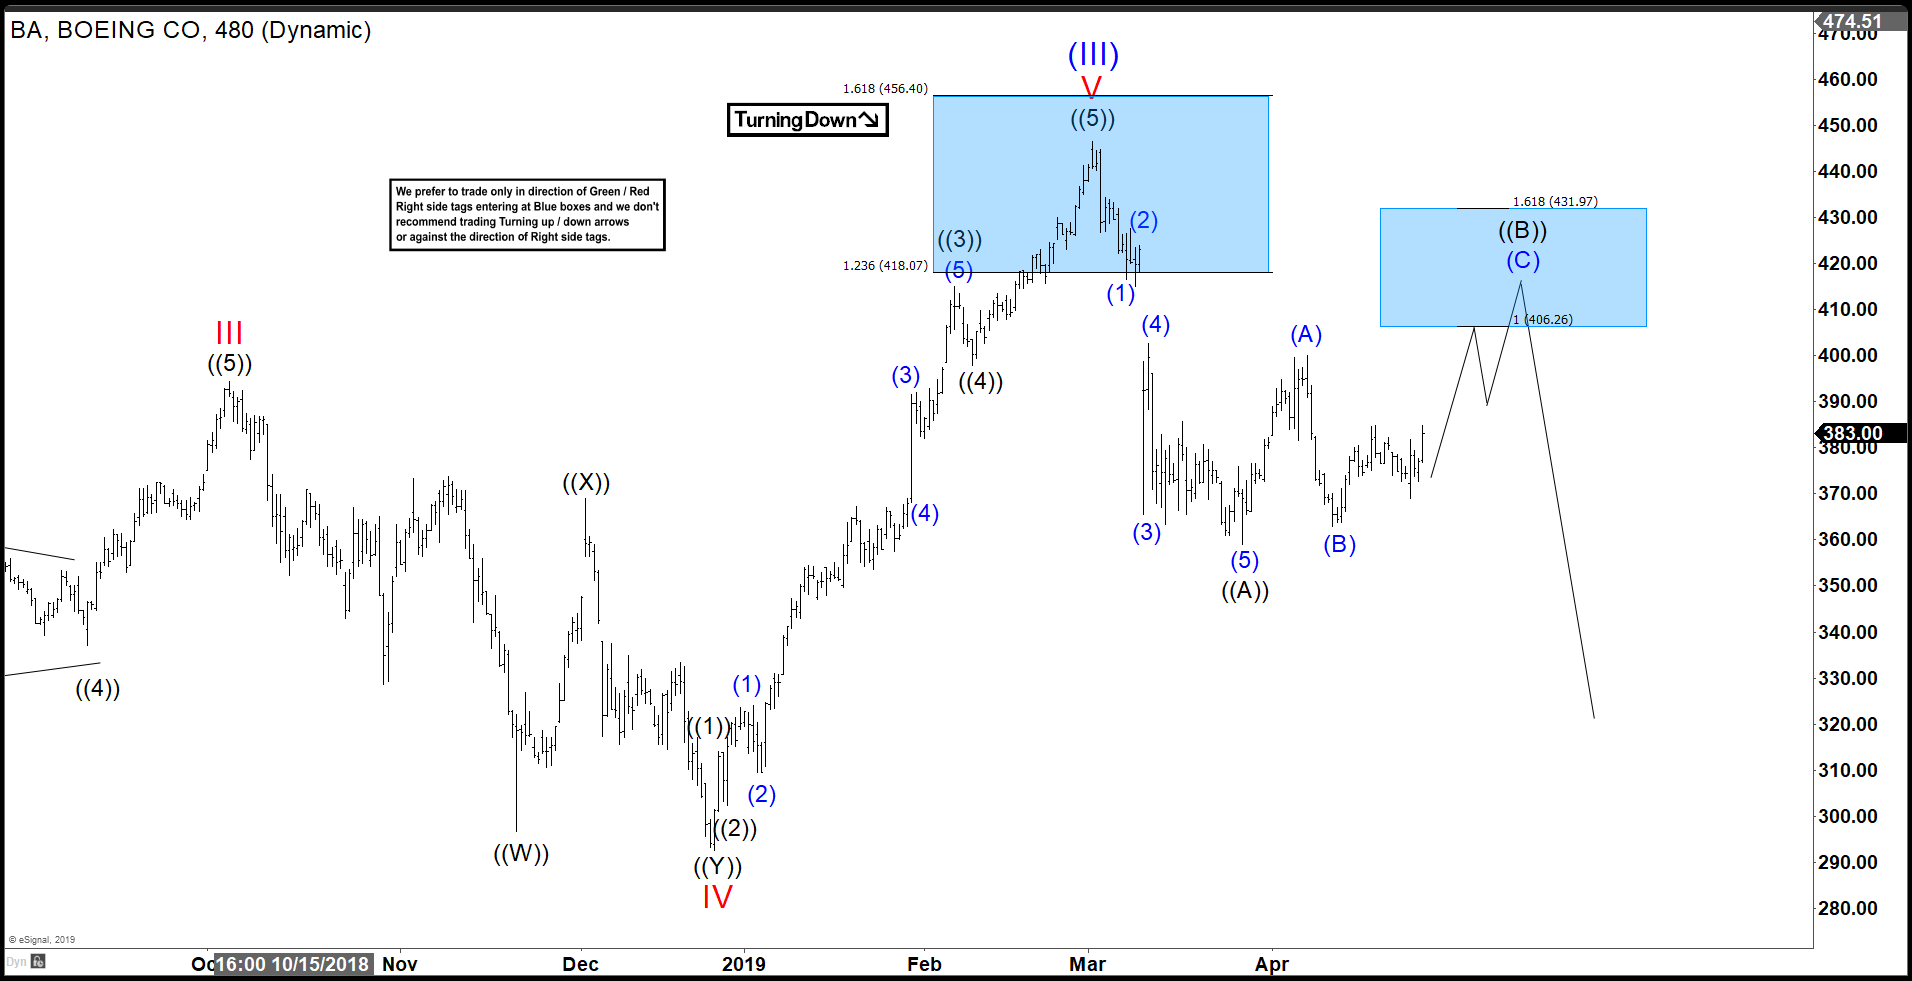
Elliott Wave view in Boeing suggests that the rally to $446.49 ended wave (III) in super cycle degree. The stock is now doing the biggest pullback since 2003 low within wave (4). The decline from $446.49 to $359.01 ended wave ((A)) as an impulse Elliott Wave structure. Wave (1) ended at $416.44, wave (2) ended at $427.70, wave (3) ended at $365.55, wave (4) ended at $402.67, and wave (5) ended at $359.01.
The 5 waves move lower ended wave ((A)) in larger degree as the first leg of a zigzag. The stock has started to recover in wave ((B)). The recovery also takes the form of a zigzag Elliott Wave structure. Up from $359.01, wave (A) ended at $399.95, wave (B) ended at $362.92, and wave (C) of ((B)) is expected to end at $406.26 – $431.97. We expect the rally to fail in 3, 7, or 11 swing as far as the pivot at $446.49 high stays intact. Once wave ((B)) completes, wave ((C)) should start and can take the stock lower and break below $359.01. Potential target for wave (IV) pullback is 23.6 – 38.2% Fibonacci retracement at $285.1 to $346.6.
8 Hour Boeing (BA) Elliott Wave Chart Asia Update


