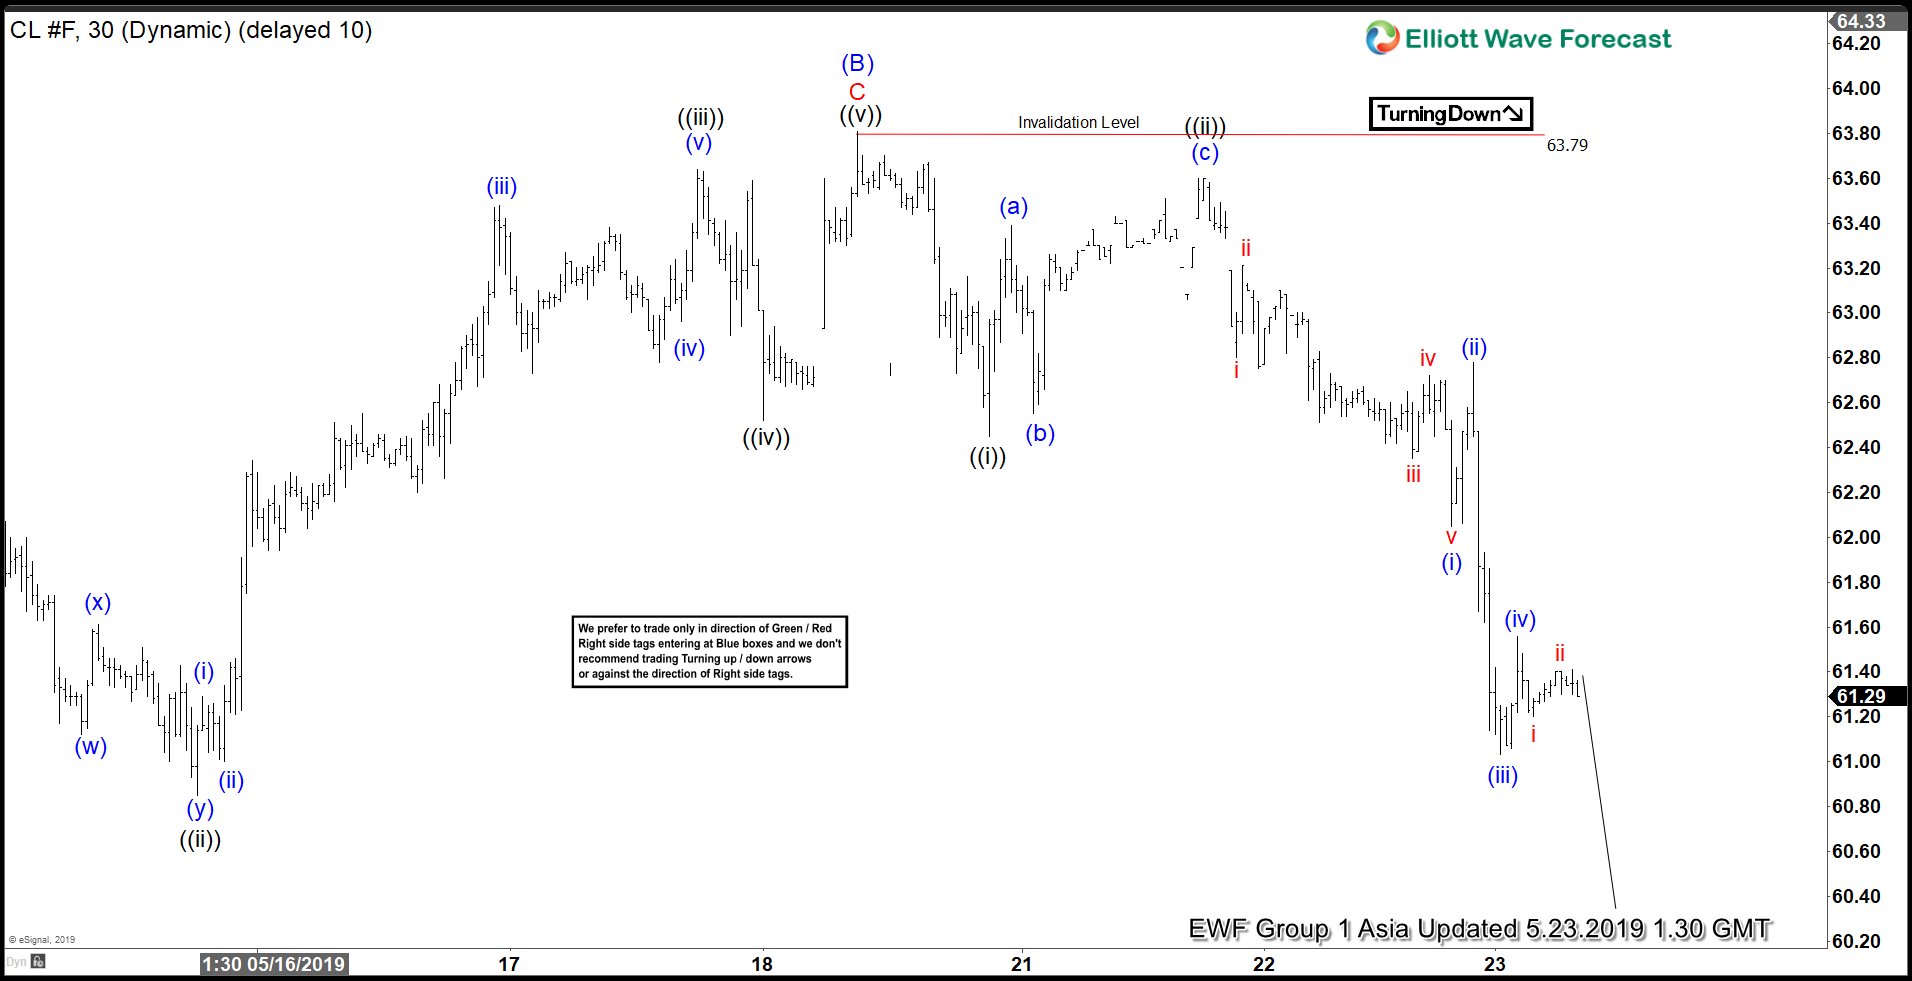
Elliott Wave view on Oil (CL_F) suggests the move from April 23 peak ($66.6) unfolded as 5 waves which ended wave (A) at $60.04. In the chart below, we can see that wave (B) bounce has ended at $63.78. Oil has since turned lower in wave (C). However, it still needs to break below $60.04 to confirm the next leg lower and avoid a double correction.
The decline from $63.78 appears to unfold as an impulse Elliott Wave structure where wave 1 of (C) remains in progress. Down from $63.78, wave ((i)) ended at $62.45 and wave ((ii)) ended at $63.60. Wave ((iii)) of 3 subdivides also as an Elliott Wave impulse in lower degree. Near term, while bounce fails below $63.78, expect Oil to extend lower. We don’t like buying Oil and expect sellers to appear in 3, 7, or 11 swing as far as pivot at $63.78 stays intact. A break below $60.04 will confirm the next leg lower in wave (C). A 100% extension target from April 23 peak can see Oil reaching $55.6- $57.2 at least.


