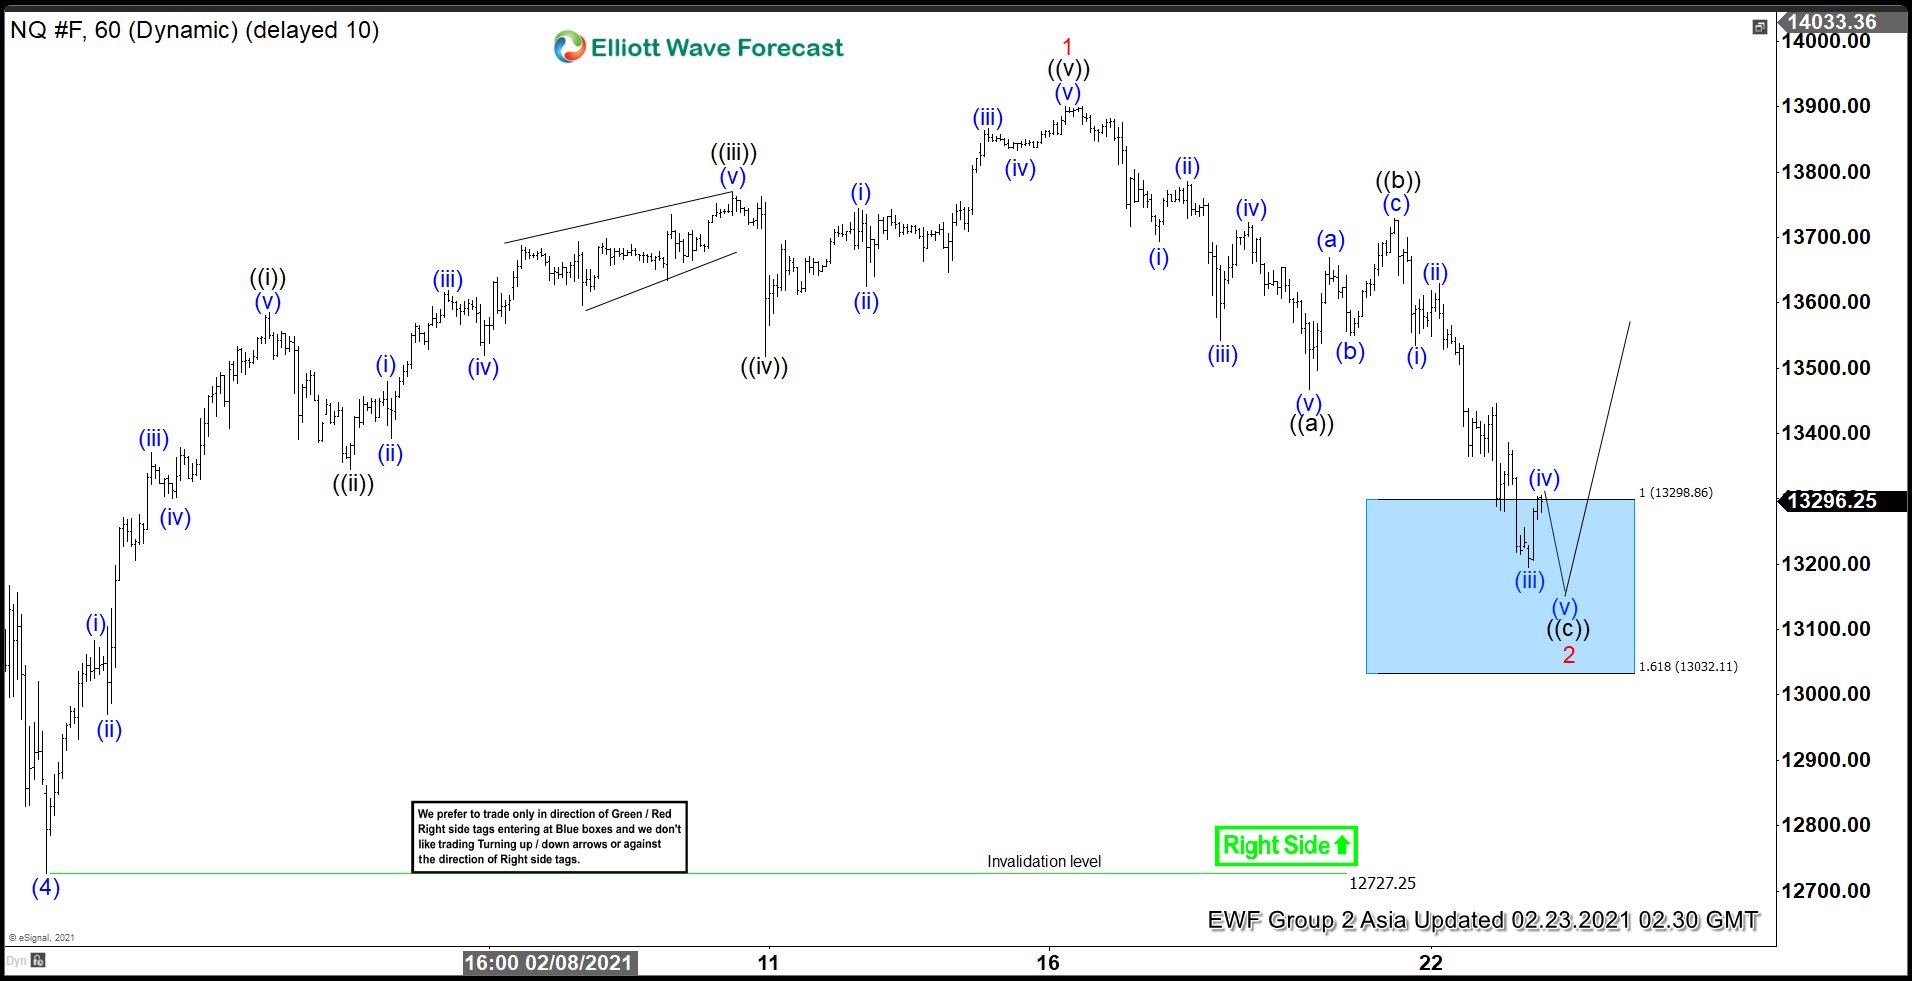
Short Term Elliott Wave in Nasdaq (NQ) suggests the rally from September 21, 2020 low is unfolding as a 5 waves impulse Elliott Wave structure. In the chart below, we can see wave (4) ended at 12727.25. Index has resumed higher in wave (5) with subdivision as another 5 waves in lesser degree. Up from wave (4) low, wave ((i)) ended at 13584.5, and pullback in wave ((ii)) ended at 13345.25. Index then resumed higher in wave ((iii)) which ended at 13769.25 and pullback in wave ((iv)) ended at 13517.75. The final leg wave ((v)) ended at 13900.50 and this also completed wave 1 of (5) in higher degree
Wave 2 pullback is currently in progress to correct cycle from February 1, 2021 low before the rally resumes. Internal of wave 2 is unfolding as a zigzag where wave ((a)) ended at 13468 and bounce in wave ((b)) ended at 13729. The Index has reached potential support area for wave ((c)) at 100% – 161.8% Fibonacci extension of ((a))-((b)) which comes at 13032-13298. Expect Index to end wave ((c)) soon and buyers should appear at this area and the Index can see a new high or bounce in larger 3 waves at least. A move towards or below 161.8 extension at 13032 however increases the risk that the decline from February 16, 2021 high (13900.5) becomes impulsive. As far as pivot at 12727 low stays intact, expect Index to end wave 2 pullback soon and turns higher.


