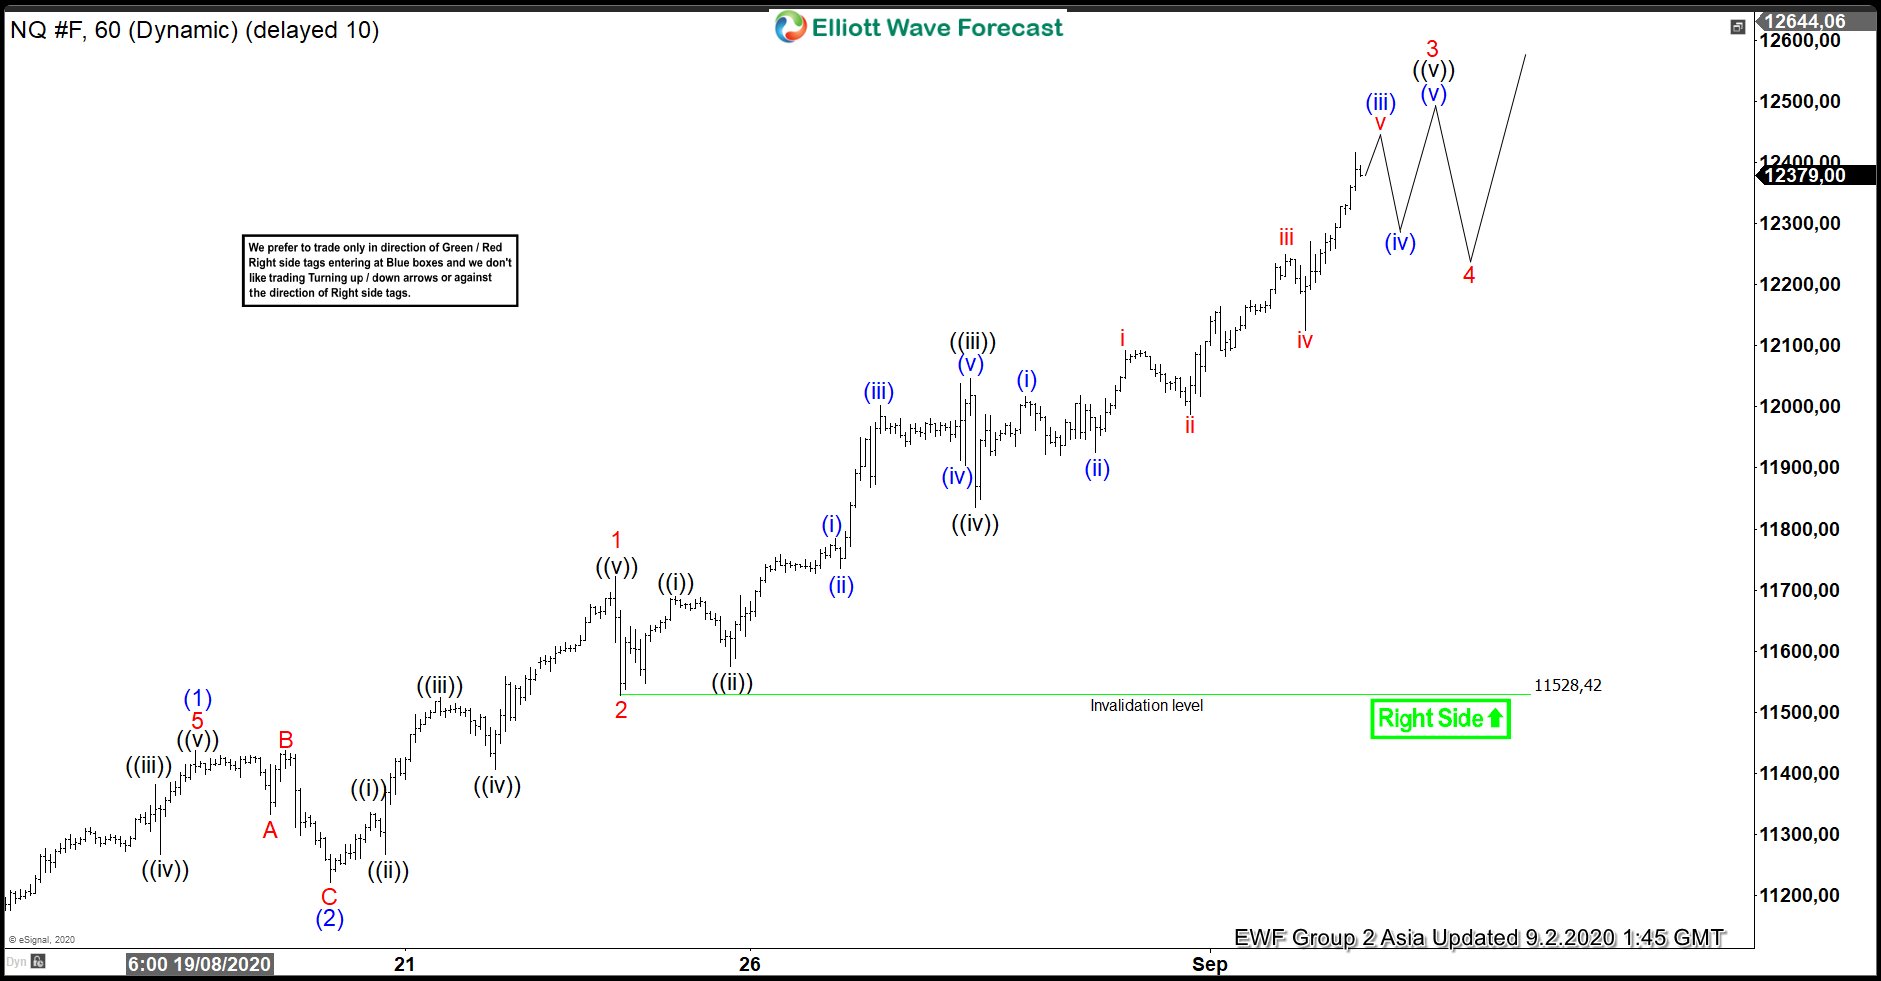
Elliott Wave View of NASDAQ (NQ_F) suggests the Index ended the cycle from August 12 low as wave (1) at 11437 high. The pullback in wave (2) unfolded as zigzag correction and ended at 11221.50 low. The index then continued to rally higher in wave (3). Up from August 20 low, wave 1 ended at 11722.50 high. The subdivision of wave 1 unfolded as 5 waves impulse Elliott Wave Structure. Wave ((i)) ended at 11336.75 high and wave ((ii)) dip ended at 11267 low. Index then extended higher in wave ((iii)) towards 11524 high. Wave ((iv)) pullback then ended at 11407 low. Finally, wave ((v)) higher ended at 11722.50 high. This final move completed wave 1 in higher degree.
Afterwards, Index corrected within wave 2, which ended at 11528.42 low. From there, Index resumed the rally and extended higher. Currently, wave 3 is in progress and can see a few more highs before ending the cycle from August 24 low. This would be followed by wave 4 pullback later in 3,7 or 11 swings. While above 11528.42 low, expect the dips in 3,7 or 11 swings to continue to find support for more upside.


