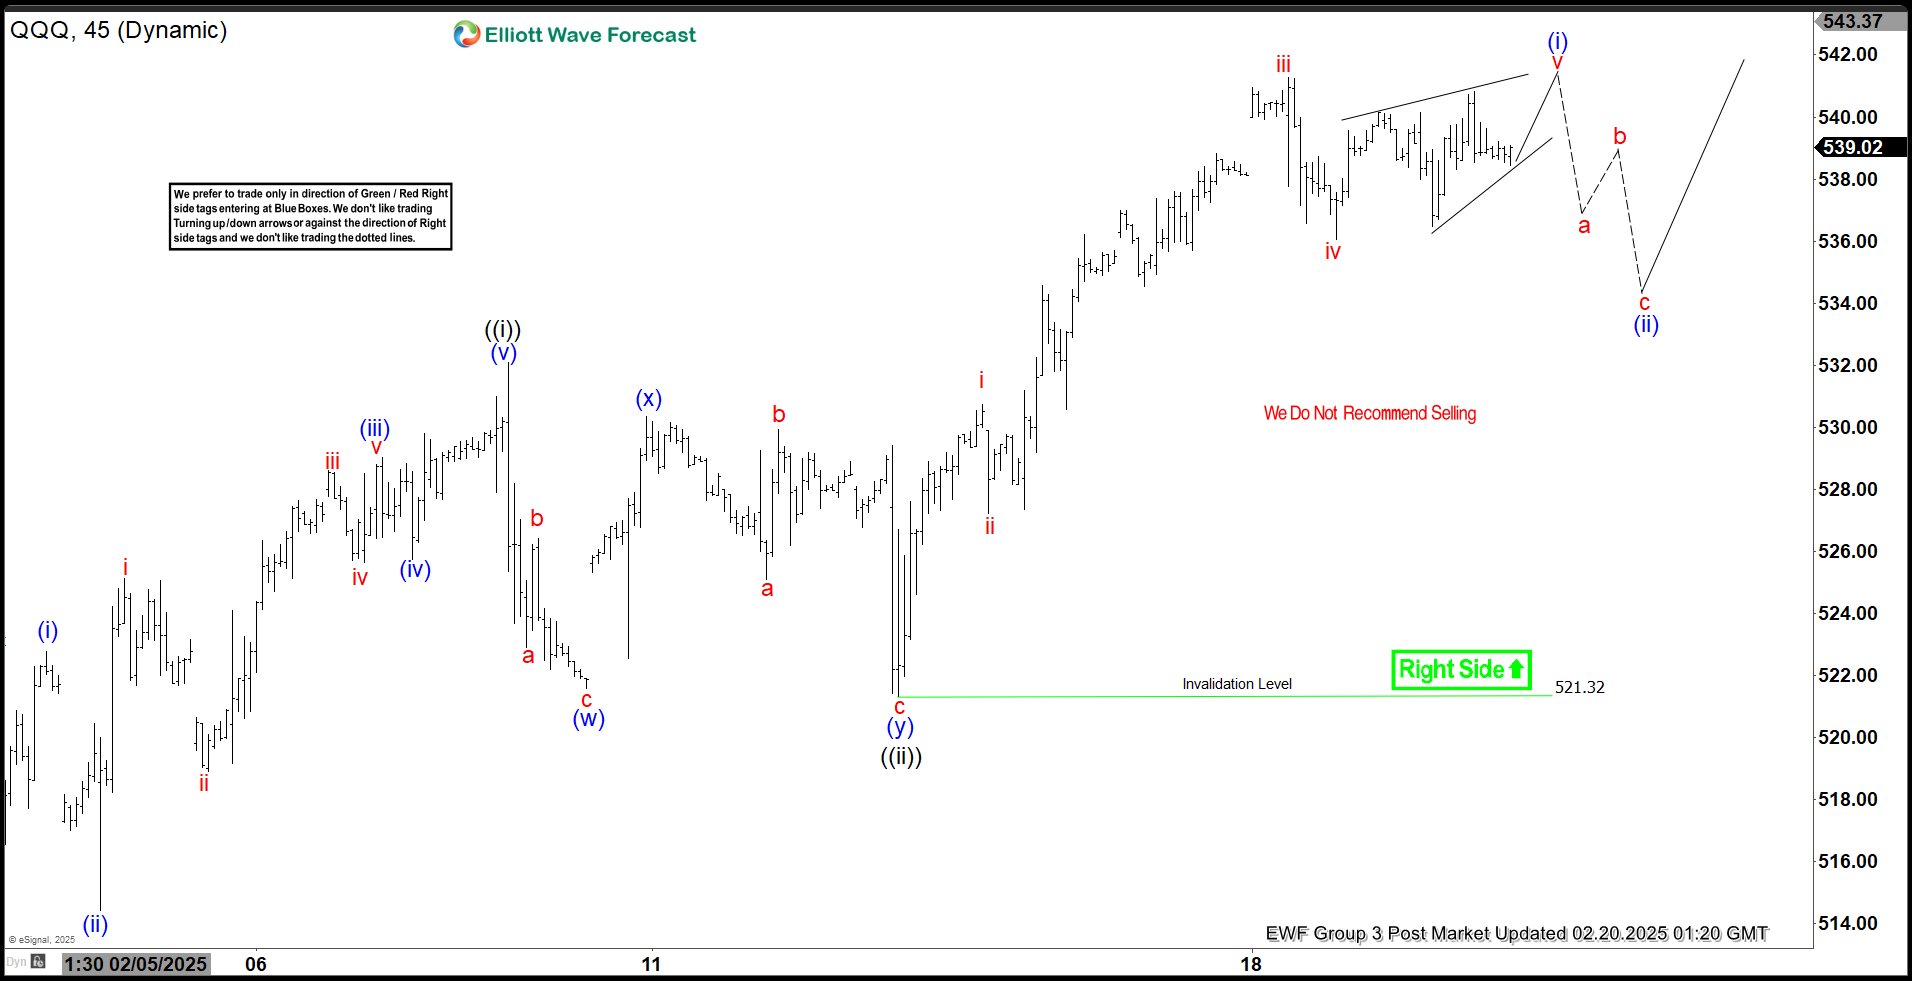
Nasdaq 100 ETF (QQQ) has broken to new all-time high suggesting the right side remains firmly bullish. The rally from 1.27.2025 low is in progress as a 5 waves with extension (nest).
Detailed Wave Breakdown
Current Impulse Wave Structure
Up from 1.27.2025 low, wave 1 ended at 531.52 and pullback in wave 2 ended at 507.5. The ETF has extended higher in wave 3. Up from wave 2, wave ((i)) ended at 532.10. Pullback in wave ((ii)) unfolded as a double three Elliott Wave structure. Down from wave ((i)), wave (w) ended at 521.56, and wave (x) ended at 530.36. Wave (y) lower ended at 521.32 which also completed wave ((ii)) in higher degree.
Immediate Wave Projection
The ETF has resumed higher in wave ((iii)). Up from wave ((ii)), wave i ended at 530.72 and pullback in wave ii ended at 527.22. Wave iii higher ended at 541.28 and pullback in wave iv ended at 536.04. Expect wave v to complete soon which should end wave (i) in higher degree. The ETF should then pullback in wave (ii) to correct cycle from 2.12.2025 low before it resumes higher.
Critical Support & Trading Strategy
Near term, as far as pivot at 521.32 low stays intact, expect pullback to find support in 3, 7, or 11 swing for further upside.
Nasdaq 100 ETF (QQQ) 45 Minutes Elliott Wave Chart
Chart Analysis: Current wave count showing extended Wave 3 with detailed subdivisions.
Video Update: QQQ Elliott Wave Outlook
Access Real-Time QQQ Analysis
Our members receive:
- 🔄 Continuous wave count updates across multiple timeframes
- 🎯 Precise entry/exit levels with risk management
- 💬 24/5 analyst support in member chat rooms


