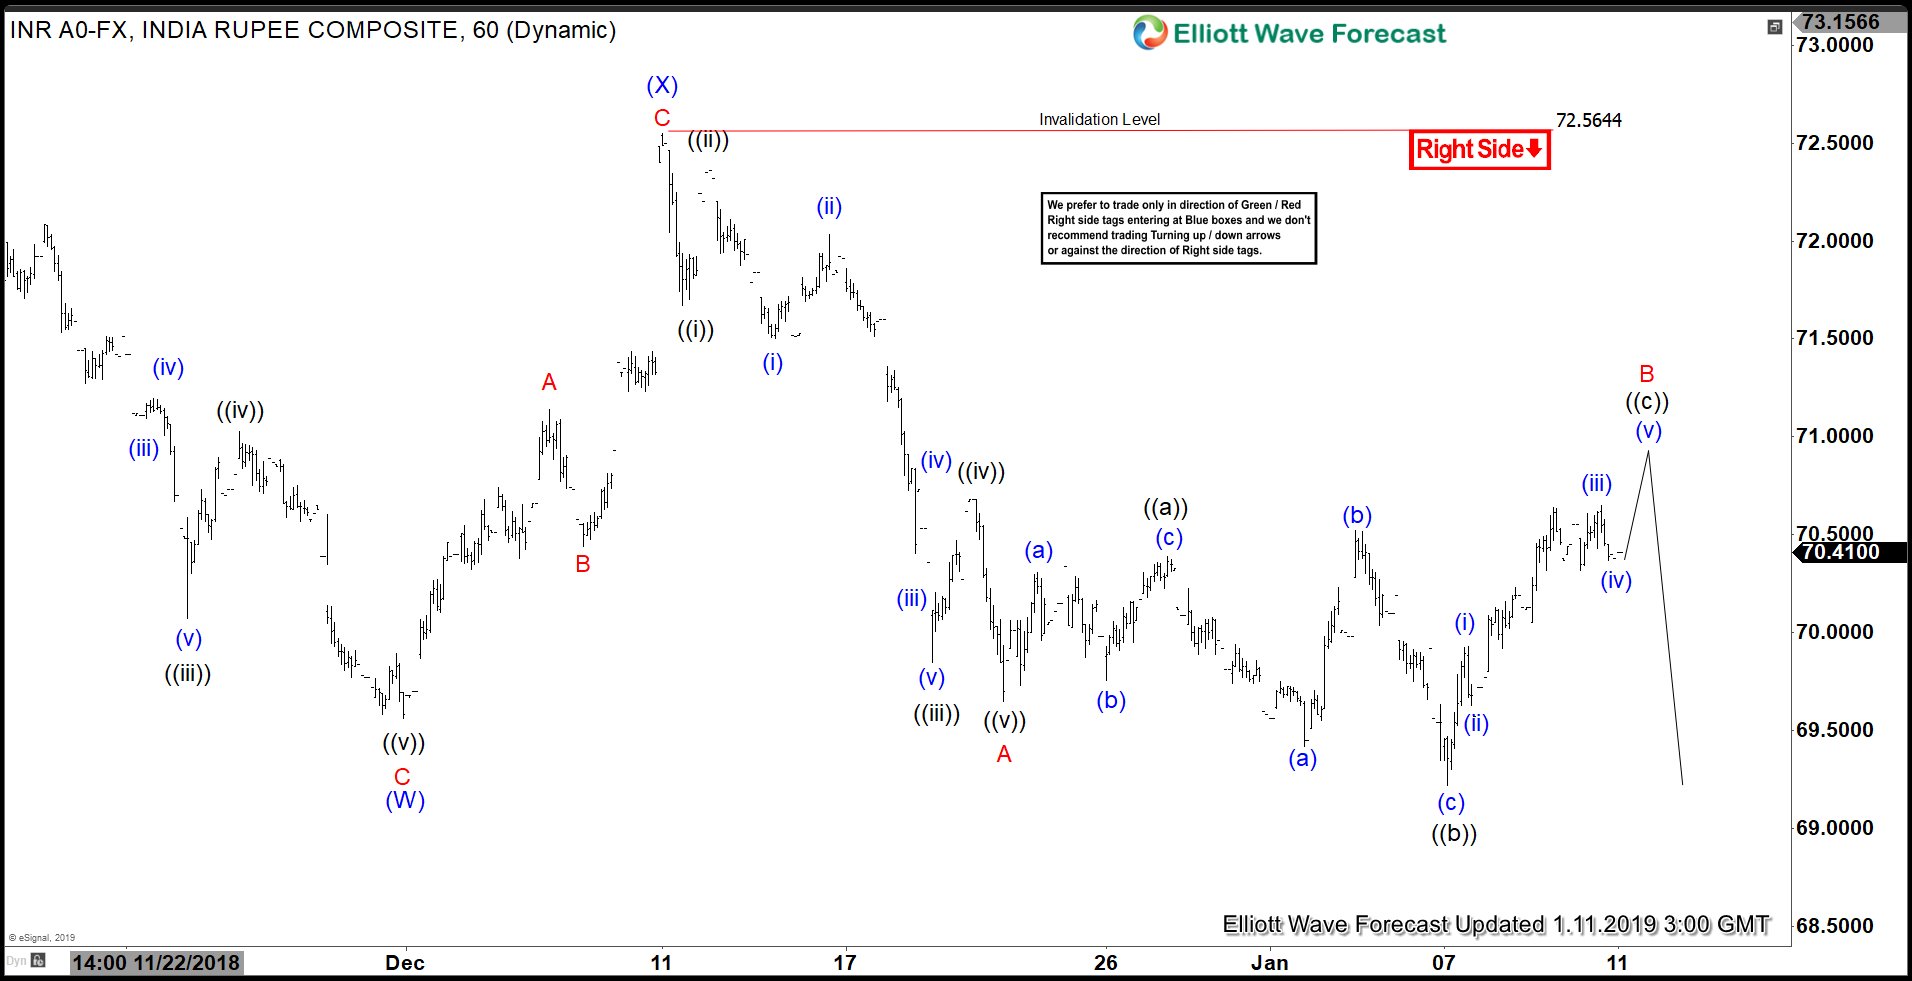
Short term Elliott Wave view in USDINR suggests that the decline to 69.56 low ended wave (W) and bounce to 72.56 high ended wave (X). Internal of wave (X) unfolded as a zigzag Elliott Wave structure. Wave A ended at 71.14, wave B ended at 70.44 and wave C ended at 72.55. Pair has resumed lower with the break below wave (W) at 69.56 and now shows a bearish sequence from 10.11.2018 peak.
Wave (Y) lower is unfolding as a zigzag where wave A ended at 69.65. Subdivision of wave A is in 5 waves impulsive Elliott Wave structure. Down from 72.56, Wave ((i)) ended at 71.67, wave ((ii)) ended at 72.36, wave ((iii)) ended at 69.847, wave ((iv)) ended at 70.68, and wave ((v)) of A ended at 69.65.
Wave B is currently in progress as an Expanded Flat Elliott Wave structure. Up from 69.65, wave ((a)) ended at 70.39 and wave ((b)) ended at 69.22. Wave ((c)) of B is expected to end below 72.56 and pair should then resume lower again. Potential area to end wave B is towards 70.89 – 71.77 (50 – 76.4 Fibonacci retracement) of the decline from 72.56. As far as pivot at 72.56 high is holding, expect pair to eventually resume lower again.


