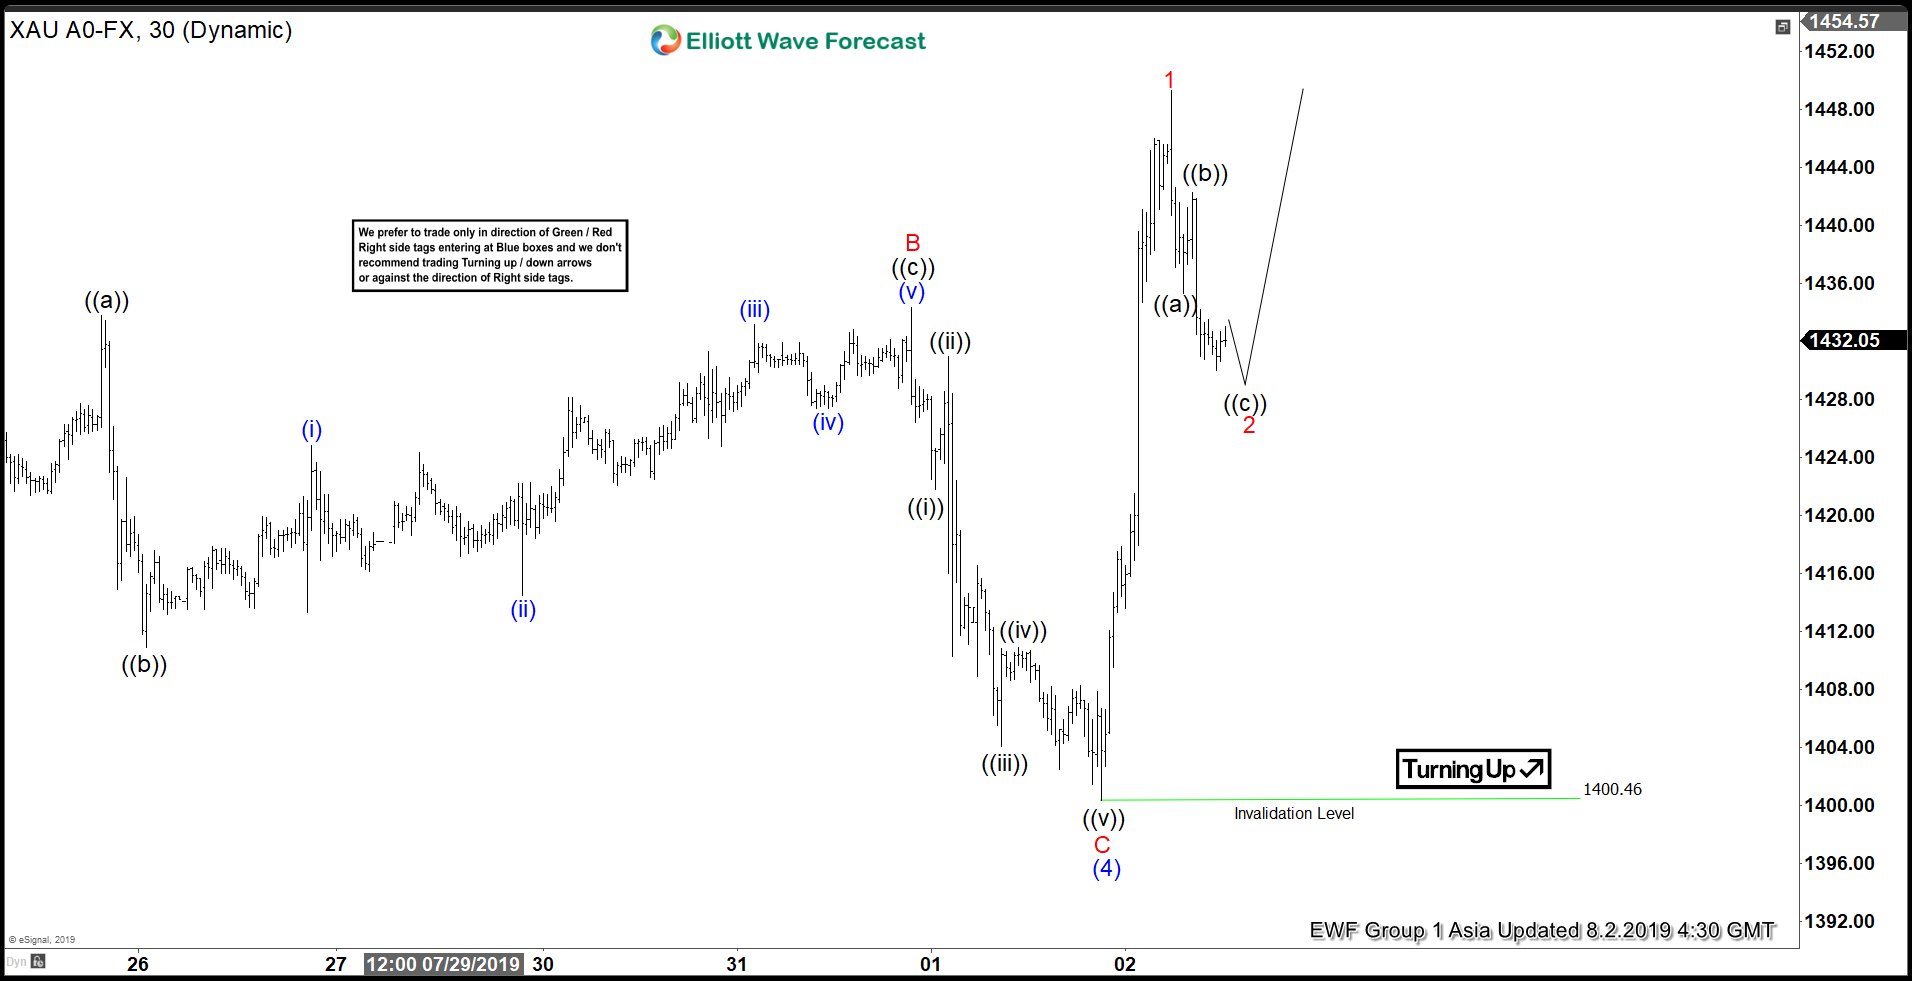
Elliott Wave view suggests the pullback to 1400.46 in Gold ended wave (4). Internal of wave (4) pullback unfolded as a zigzag from July 19 high (1452.95). On the chart below, we can see wave B of this zigzag ended at 1434.35 and wave C ended at 1400.46. Wave B further subdivides as a Flat structure where wave ((a)) ended at 1433.8, wave ((b)) ended at 1410.90, and wave ((c)) ended at 1434.35.
The decline in wave C of (4) unfolded as an impulse where wave ((i)) ended at 1421.8 and wave ((ii)) ended at 1430.95. Wave ((iii)) ended at 1404.10, wave ((iv)) ended at 1410.91, and wave ((v)) of C ended at 1400.46. Gold has now resumed higher in wave (5). The internal of wave (5) is unfolding as an impulse Elliott Wave structure. Up from 1400.46, wave 1 ended at 1449.30.
Wave 2 pullback is in progress to correct cycle from August 1 low. The pullback is expected to unfold in 3, 7, or 11 swing. As far as pivot at 1400.46 stays intact, expect the yellow metal to resume higher again. The metal still needs to break above July 19 high (1452.95) to confirm the next leg higher has really started. We don’t like selling Gold.


