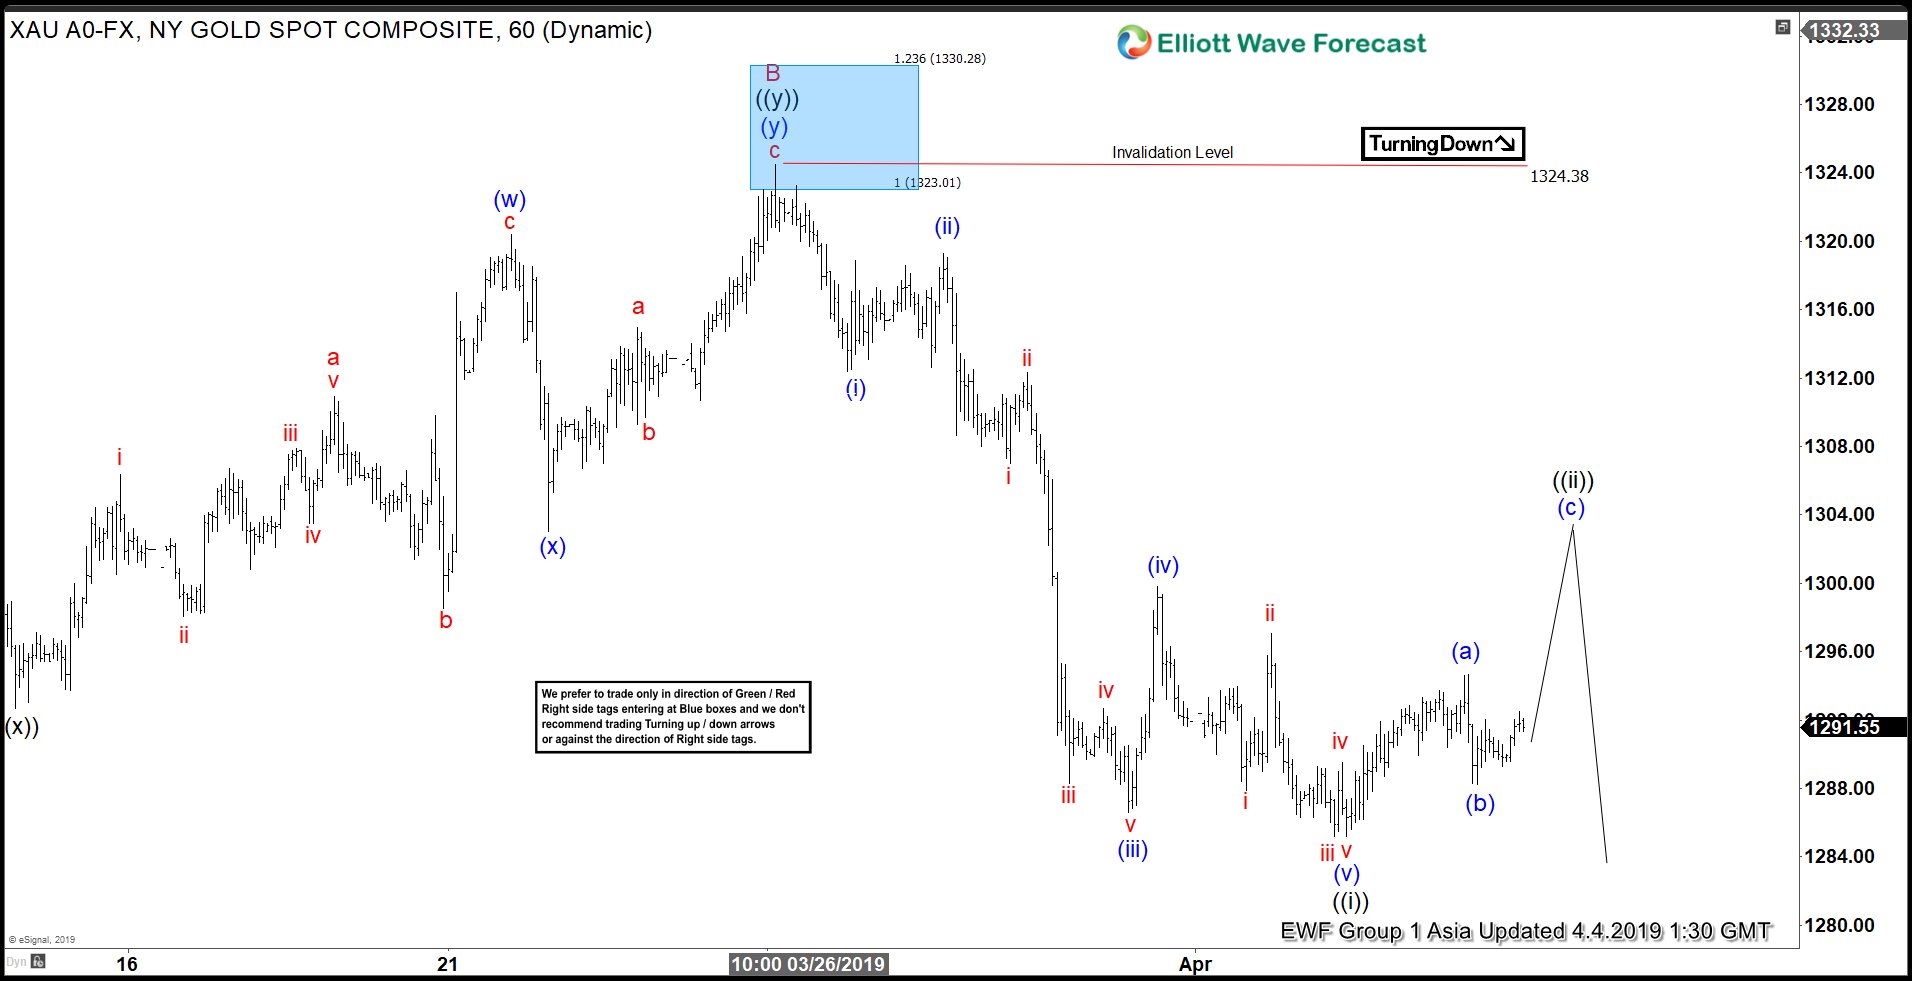
Elliott Wave view suggests that Gold has ended cycle from August 16, 2018 low ($1160.37). The yellow metal is currently correcting that cycle as a zigzag Elliott Wave structure. Down from Feb 20, 2019 high, wave A ended at $1281.01 and wave B ended at $1324.38. The yellow metal still needs to break below wave A at $1281.01 to validate this view.
Wave C is in progress as a 5 waves impulse Elliott Wave structure. Down from $1324.38, wave ((i)) ended at $1285.17. In the 1 hour chart below, we can see wave ((i)) subdivides as an impulse of a lesser degree. Wave (i) of ((i)) ended at $1312.4, wave (ii) of ((i)) ended at $1319.3, wave (iii) of ((i)) ended at $1286.6, wave (iv) of ((i)) ended at $1299.82, and wave (v) of ((i)) ended at $1285.17.
Wave ((ii)) bounce takes the form of a zigzag structure where wave (a) ended at $1294.36 and wave (b) ended at $1288.20. Near term, while wave ((ii)) bounce stays below $1324.38, expect Gold to extend lower. Projected area of wave ((ii)) comes at $1297 – $1303 where wave (a) = wave (c).
1 Hour XAUUSD Elliott Wave Chart Asia Update
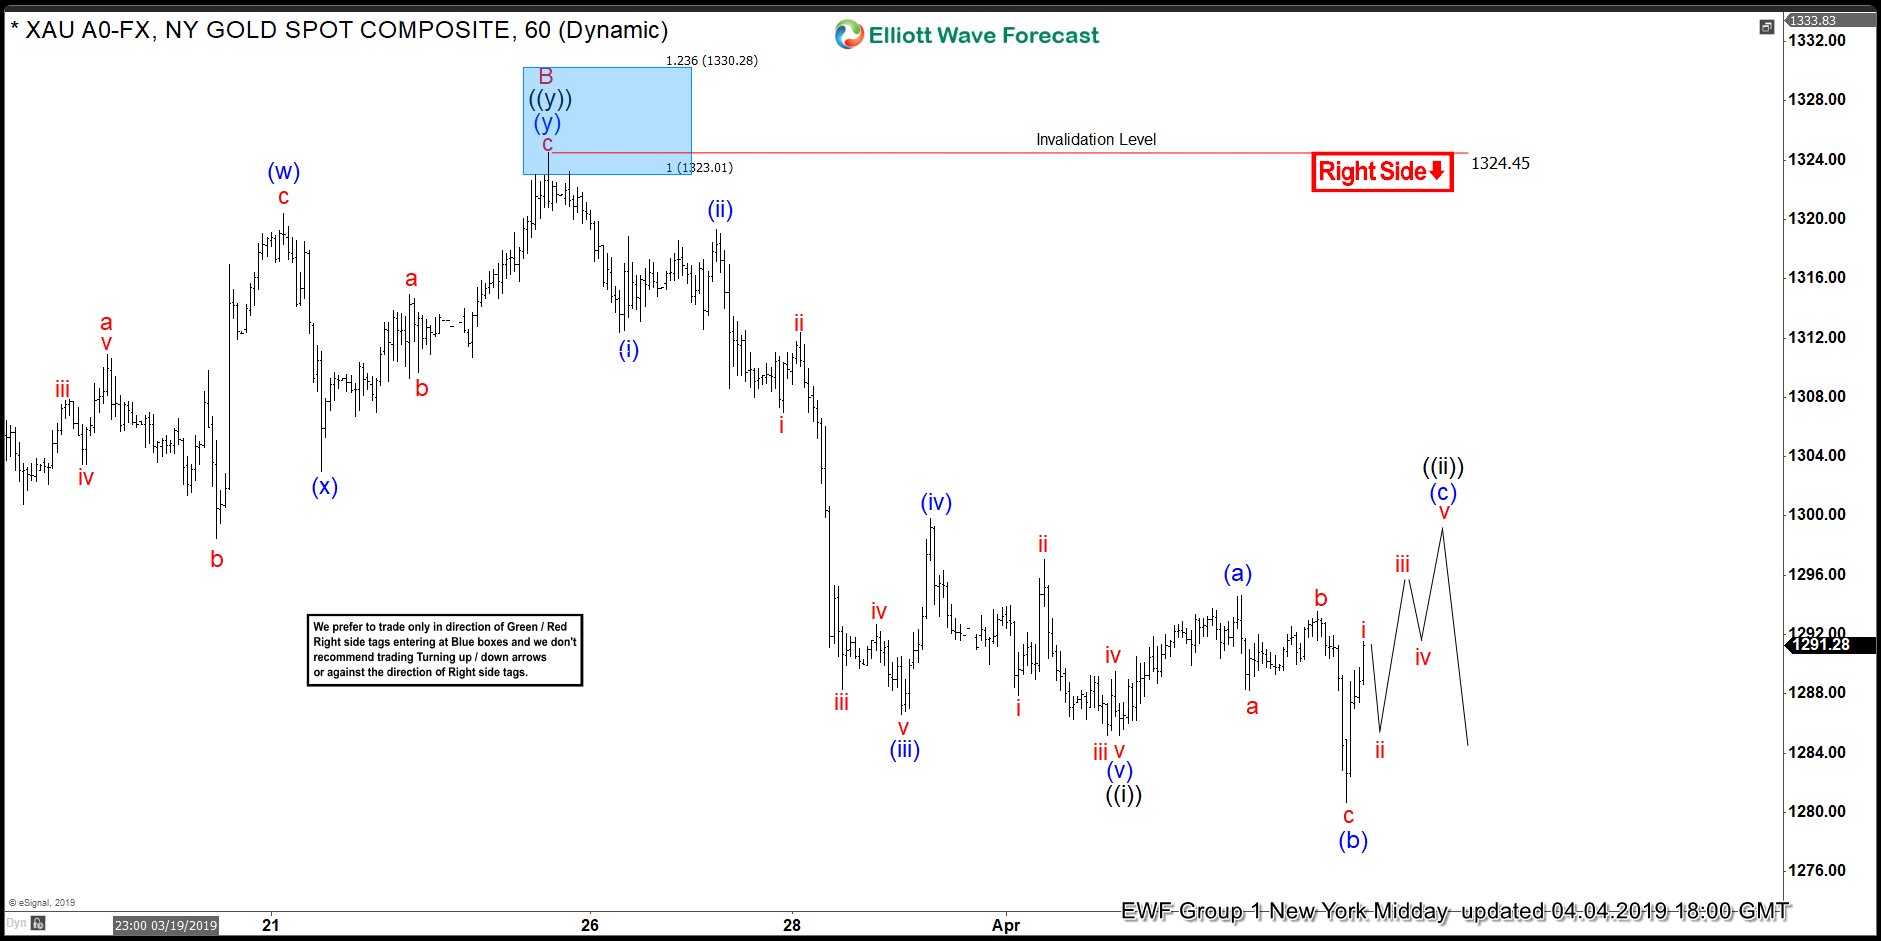
[UPDATE]: Gold made a new low below wave ((i)) low to give the impression wave ((iii)) lower has started but rally in the New York session left the decline to new lows in 3 waves which suggests the new low was most likely wave (b) and we are in wave (c) rally to complete an expanded Elliott Wave FLAT in wave ((ii)) before decline resumes in wave ((iii)) of C.


