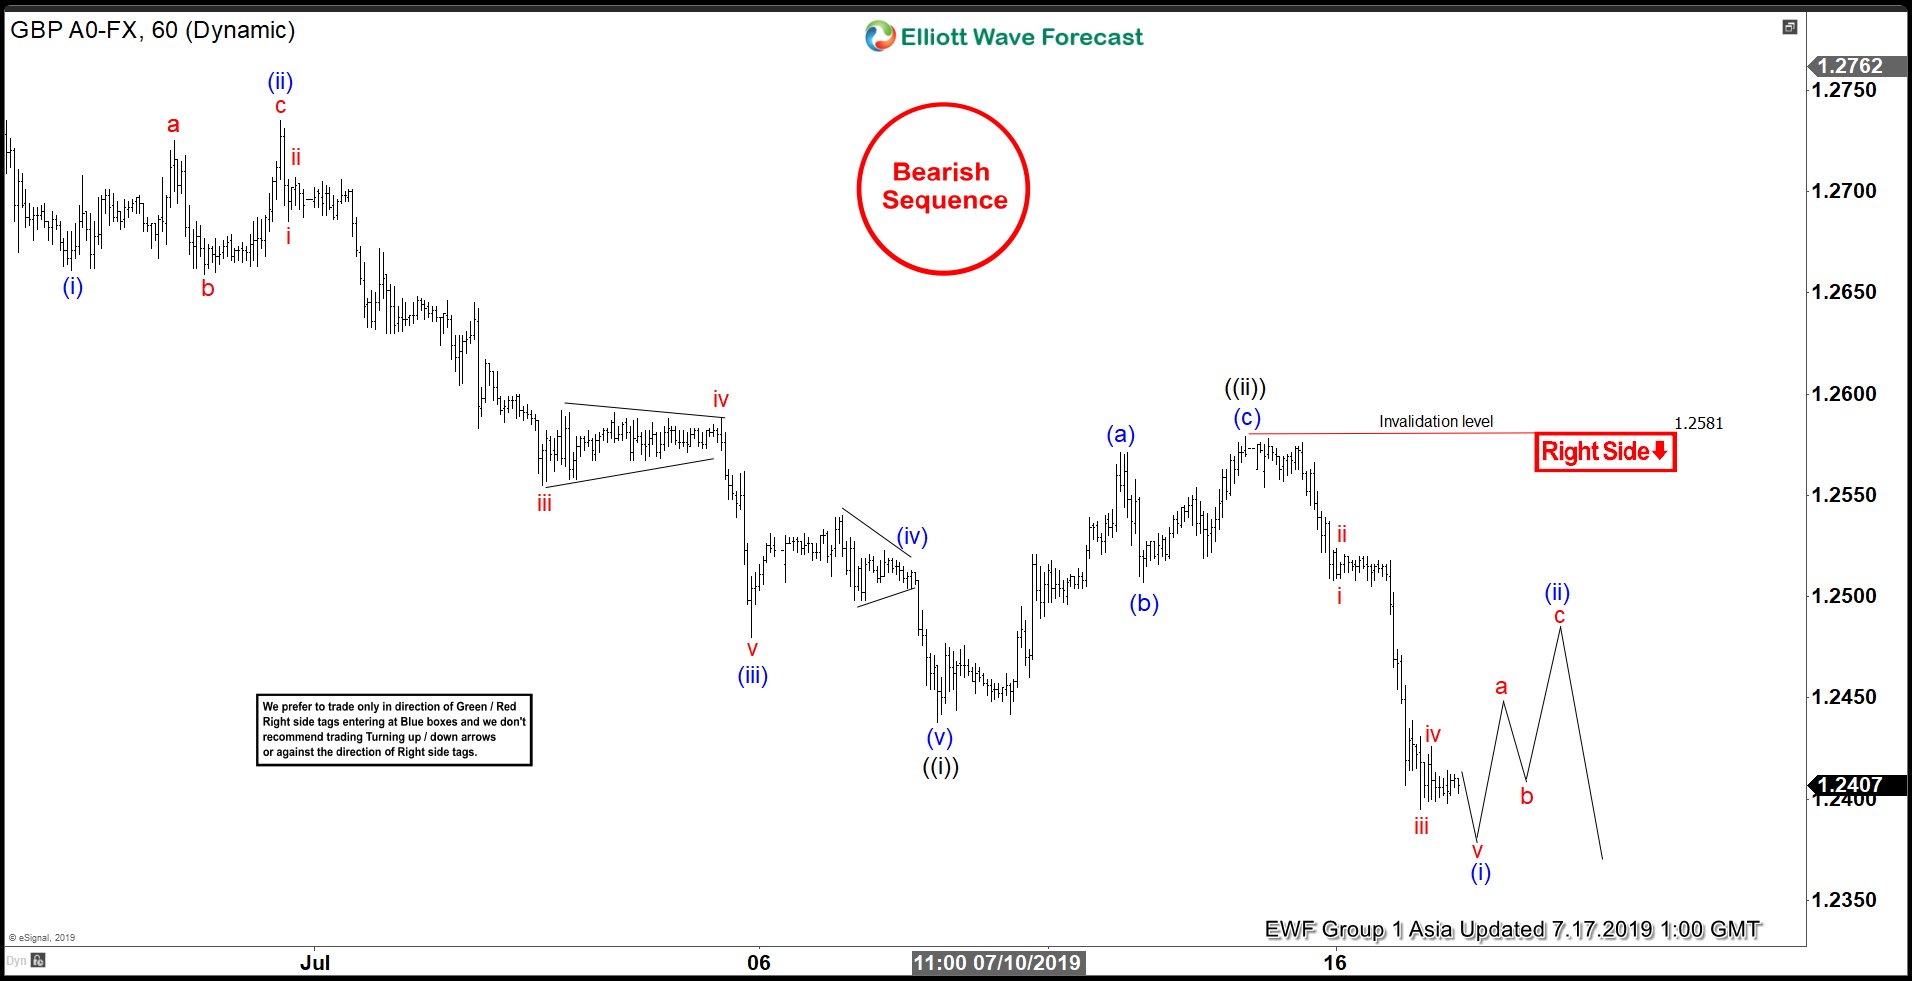
GBPUSD shows a bearish sequence from June 25 high (1.2784) favoring further downside. Near term, the decline from 1.2784 to 1.2438 ended wave ((i)) as an impulsive Elliott Wave structure. Down from 1.2784, wave (i) ended at 1.266 and wave (ii) bounce ended at 1.2735. Pair then resumed lower in wave (iii) towards 1.248 with internal subdivision also as an impulse structure of lesser degree. Wave (iv) bounce ended at 1.2513 as a triangle and wave (v) of ((i)) ended at 1.2438.
Wave ((ii)) bounce ended at 1.2581 as a zigzag Elliott Wave structure where wave (a) ended at 1.257, wave (b) ended at 1.2507, and wave (c) ended at 1.257. Pair has resumed lower in wave ((iii)) and broken below wave ((i)) confirming the next move lower has started. The move lower from 1.2581 also appears impulsive. Near term, expect wave (i) of ((iii)) to end soon, then pair should bounce in wave (ii) of ((iii)) to correct cycle from July 13, 2019 high before the decline resumes. We don’t like buying the pair and expect wave (ii) bounce to fail in 3, 7, or 11 swing for further downside as far as pivot at 1.258 stays intact in the first degree.
GBPUSD 1 Hour Elliott Wave Chart


