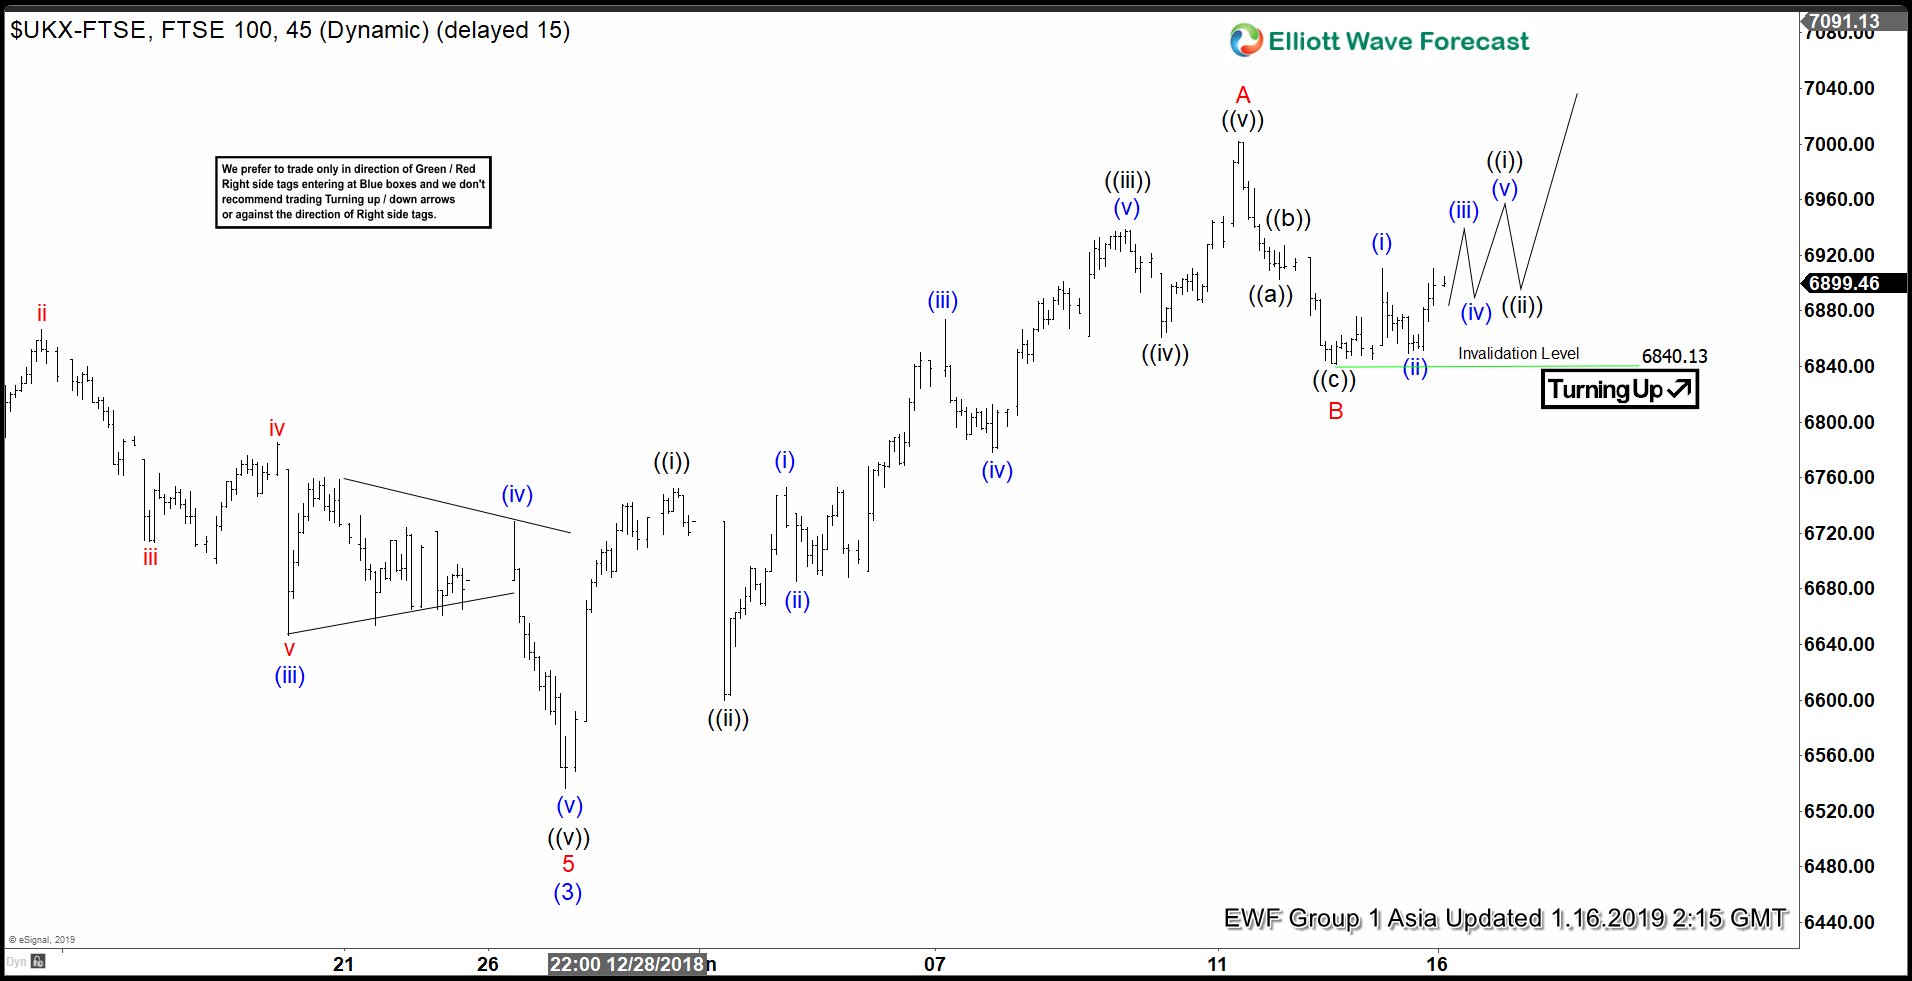
Short term Elliott Wave view on FTSE suggests that the decline to 6356.3 on Dec 27, 2018 ended wave (3). Index is now doing wave (4) correction higher. The internal of wave (4) is unfolding as a zigzag Elliott Wave structure where rally to 7001.94 ended wave A. Index then pullback to 6840.13, which we label as wave B. For better confirmation on this view, the Index needs to break above wave A at 7001.94 to suggest wave C has started.
Internal of wave A unfolded as 5 waves Elliott Wave impulse structure. Up from 6356.3, wave ((i)) ended at 6752.54, wave ((ii)) ended at 6599.48, wave ((iii)) ended at 6938.31, wave ((iv)) ended at 6860.82, and wave ((v)) of A ended at 7001.94. Wave B unfolded as a zigzag Elliott Wave structure. Wave ((a)) of B ended at 6902.65, wave ((b)) of B ended at 6927.42, and wave ((c)) of B ended at 6840.13.
Near term, while FTSE stays above 6840.13, the Index should extend higher in wave C as another 5 waves. If the Index breaks below 6840.13, then it’s doing a double correction in wave B. Potential target for wave B in a double correction scenario is approximately 6646 – 6768 (50 – 76.4 Fibonacci retracement from 6356.3) before the Index resumes higher.
FTSE 1 Hour Elliott Wave Chart
FTSE Chart of The Day Video
Back


