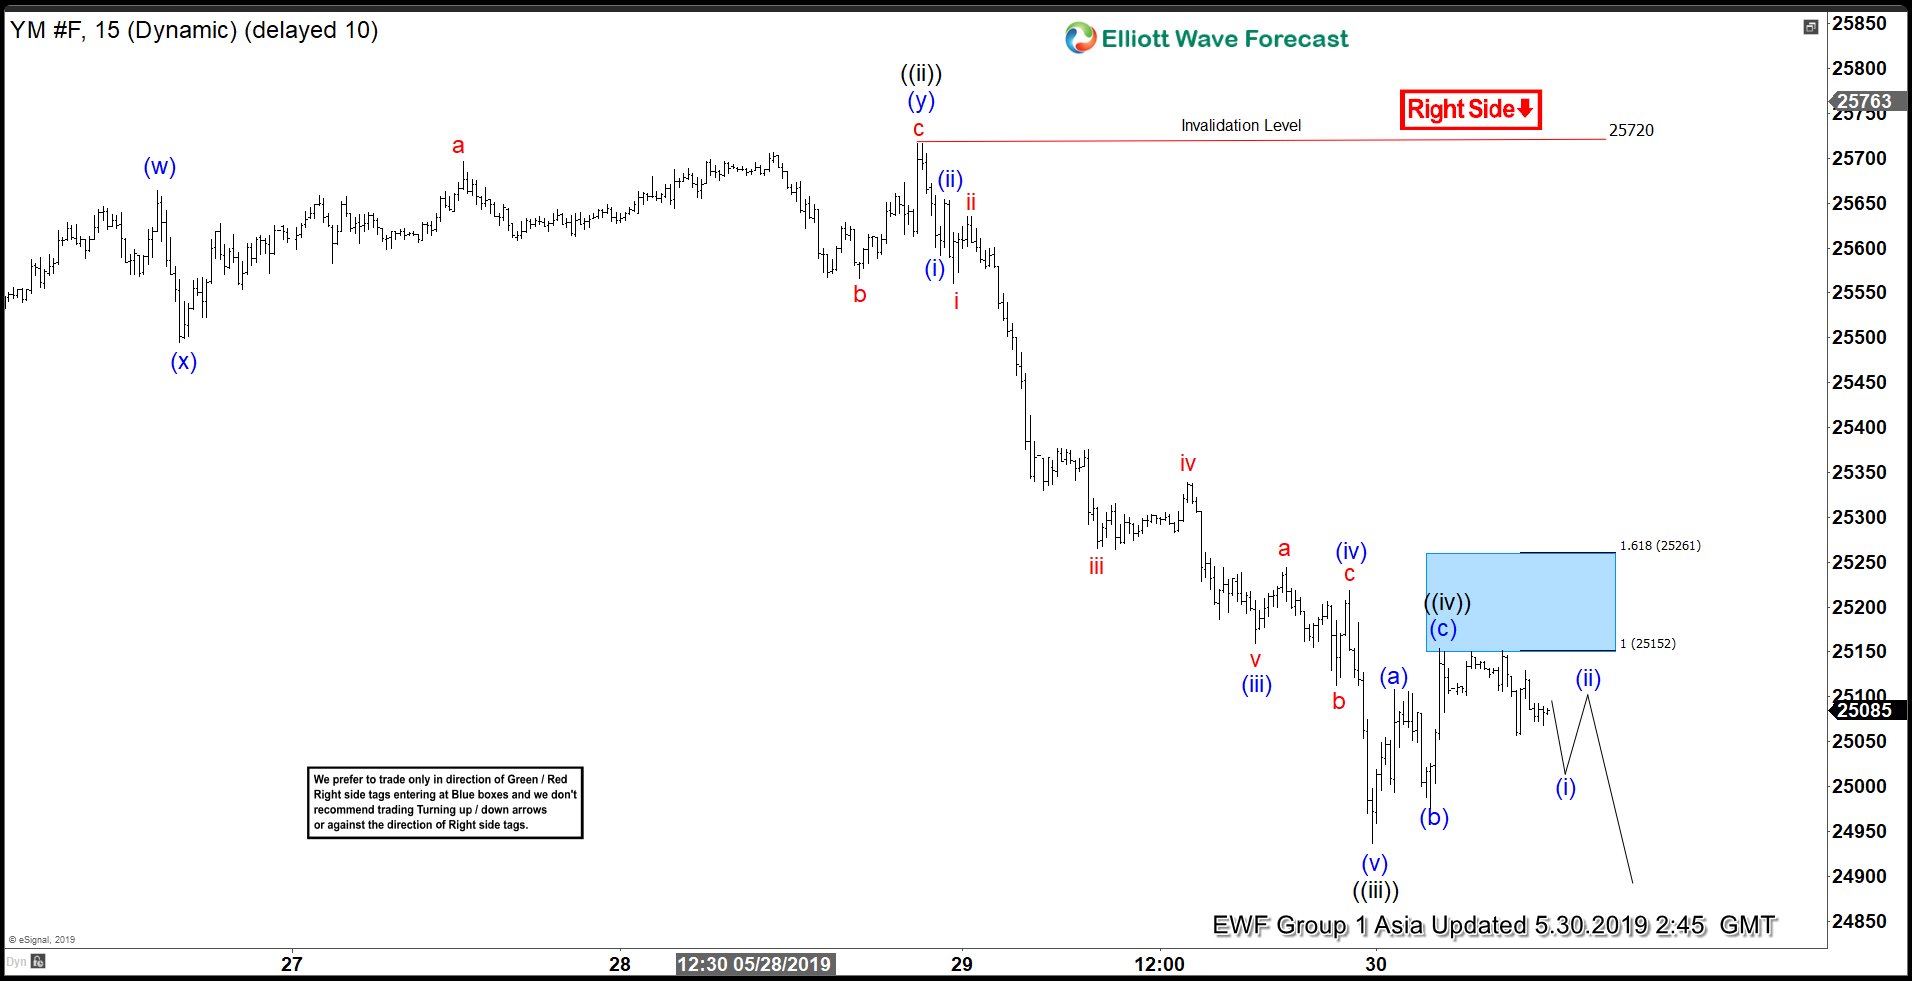
Elliott Wave view on Dow Jones Future (YM_F) suggests that the sequence from April 24, 2019 high (26694) remains incomplete and Index can see further downside. Short term, the rally to 25720 ended wave ((ii)) and wave ((iii)) ended at 24937. Internal of wave ((iii)) unfolded as Elliott Wave impulse structure. Down from 25720, wave (i) ended at 25592, wave (ii) ended at 2554, wave (iii) ended at 25159, wave (iv) ended at 25219, and wave (v) ended at 24937.
Index has resumed lower and broken the previous low on May 14 (25215), suggesting the next leg lower has started. Wave ((iv)) bounce appears complete at 25154 at the blue box area after a 3 waves bounce. Index still needs to break below wave ((iii)) at 24937 at this stage to avoid a double correction in wave ((iv)). We don’t like buying the index, and short term, while rally fails below 25720, expect Index to extend lower. If Index breaks above 25154 instead, then wave ((iv)) still remains in progress as a double zigzag Elliott Wave structure. In this alternate scenario, Index should still resume lower as far as the rally fails below 25720.
Dow Jones Future (YM_F) 1 Hour Elliott Wave Chart
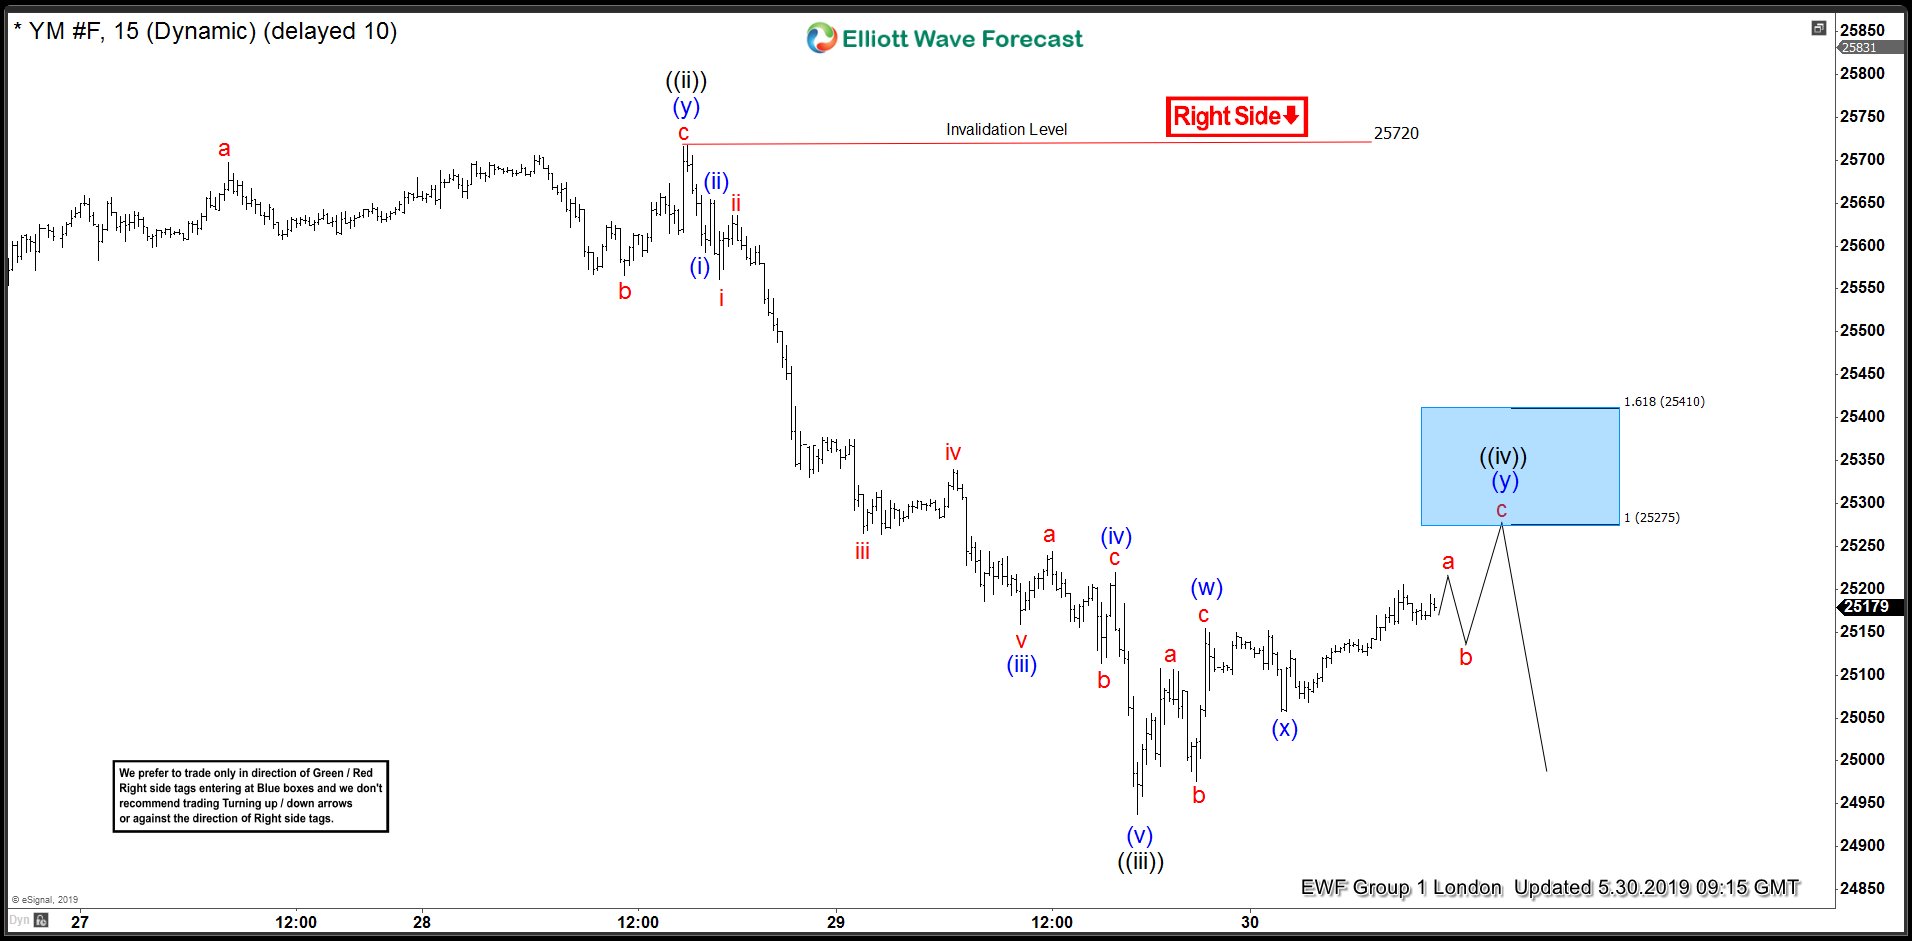
Dow Jones Futures (YM_F) 1 Hour London Updated Chart 5.30.2019
YM_F reacted lower from the blue box as shown in the above chart and reached 50 back of the rally from blue ( b) wave low. This allowed the shorts from blue box to get into a risk free position. However, afterwards it made another high and now should end 7 swings in 25275 – 25410 and start next leg lower in wave (( v)) or pull back in 3 waves at least.


