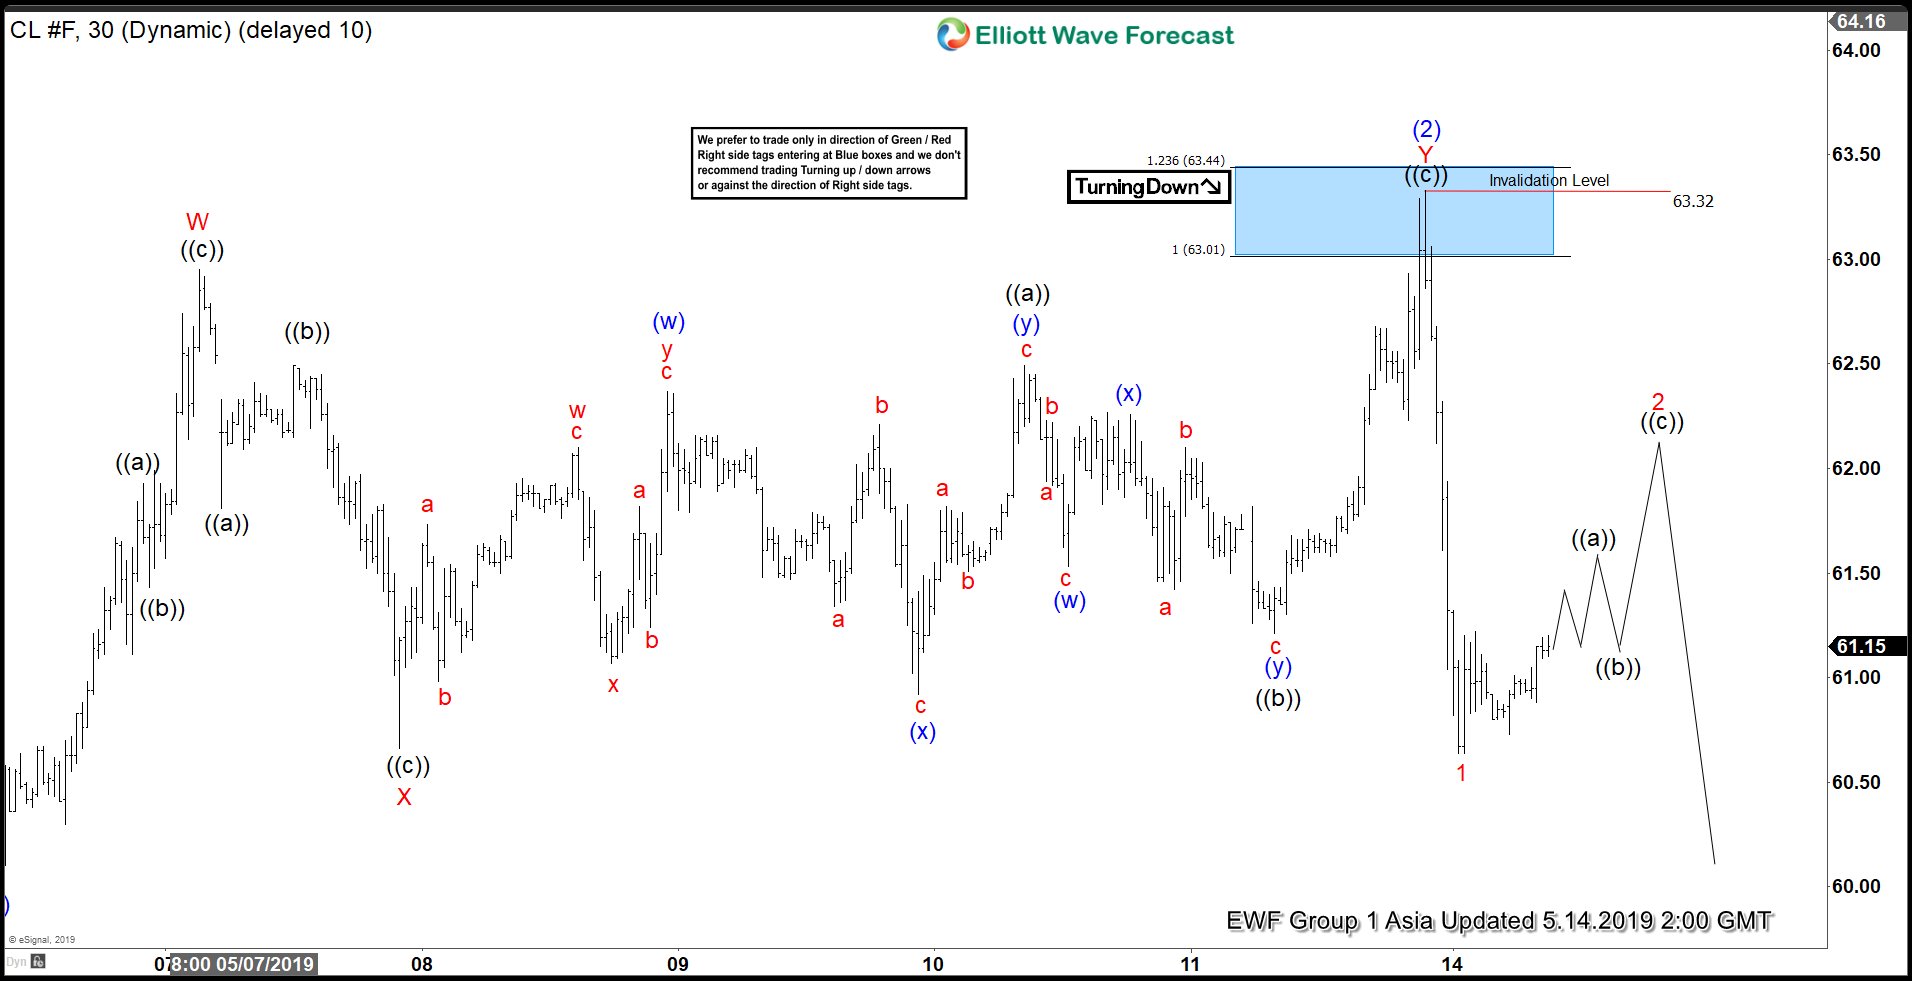
Elliott Wave view on Oil (CL_F) suggests a 5 waves decline from April 22 peak ($66.6) which ended wave (1) at $60.04. In the chart below, we can see wave (2) bounce ended at $63.32 at the blue box. The internal of wave (2) unfolded as a double three Elliott Wave structure. Up from $60.04, wave W ended at $62.95, wave X ended at $60.66, and wave Y ended at $63.32.
Oil has since turned lower in wave (3). However, it needs to break below wave (1) at $63.32 to confirm the next leg lower and avoid a double correction. The initial decline from $63.32 appears impulsive and ended wave 1 at $60.64. Wave 2 bounce is in progress to correct the cycle from $63.32 peak before the decline resumes. Potential target for wave 2 is 50% – 61.8% Fibonacci retracement of wave 1 at $62 – $62.3. We don’t like buying Oil and expect sellers to appear in 3, 7, or 11 swing as far as pivot at $63.32 stays intact. A break below wave (1) at $63.32 will confirm the next leg lower in CL_F. A 100% extension target from April 22 peak can see Oil reaching $55.3 – $56.8 at least.


