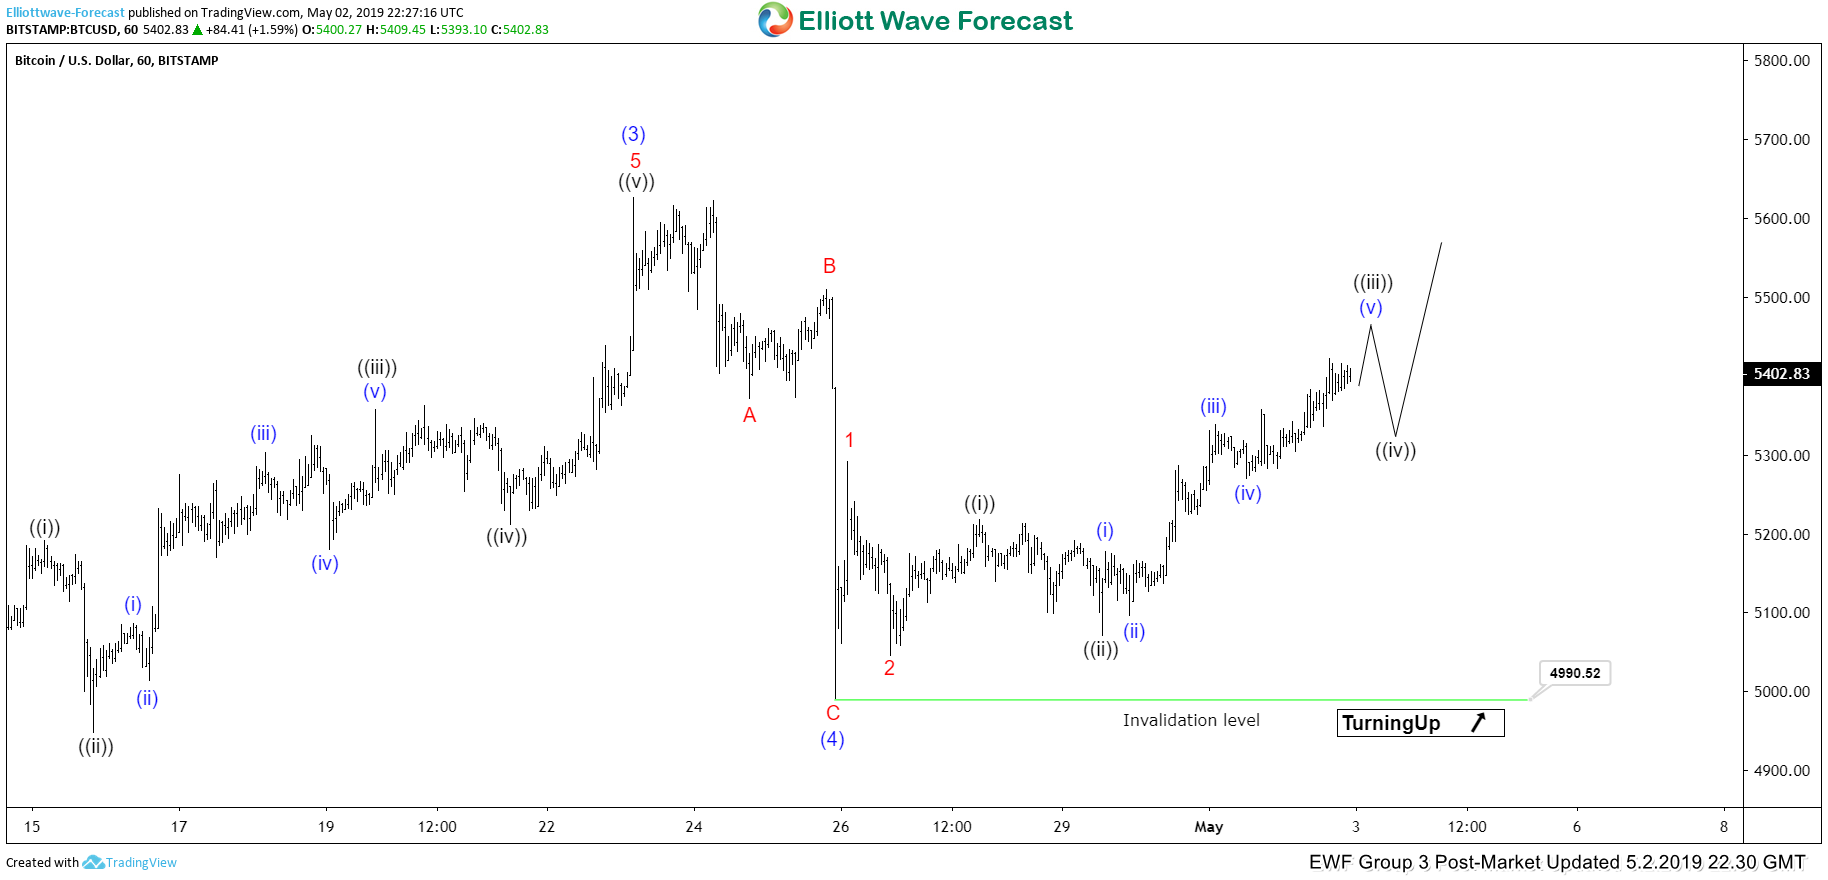
Rally in Bitcoin from December 15, 2018 appears to take the form of an impulse Elliott Wave structure. In the 1 hour chart below, we can see wave (3) of this impulse from 2018 low ended at $5627. Wave (4) pullback is proposed complete at $4990.52. The virtual currency still needs to break above wave (3) high at $5627 to validate this view and avoid a double correction.
The internal of wave (4) unfolded as a zigzag Elliott Wave structure. Wave A ended at $5372, wave B ended at $$5510, and wave C of (4) ended at $4991.42. Wave (5) rally is currently in progress to end the impulse structure from December 15, 2018 low. The internal of wave (5) is nesting as an impulse structure with wave 1 of (5) ended at $5291.48 and wave 2 of (5) ended at $5046.31. Wave 3 of (5) is in progress as another impulse of lesser degree. Near term, as far as pullback stays above $4990.52 low, expect Bitcoin to extend higher.
If the virtual currency breaks below 4990.52, then wave (4) is doing a double correction and should find buyers at the next 100% extension area from April 23, 2019 high. We do not like selling Bitcoin.


