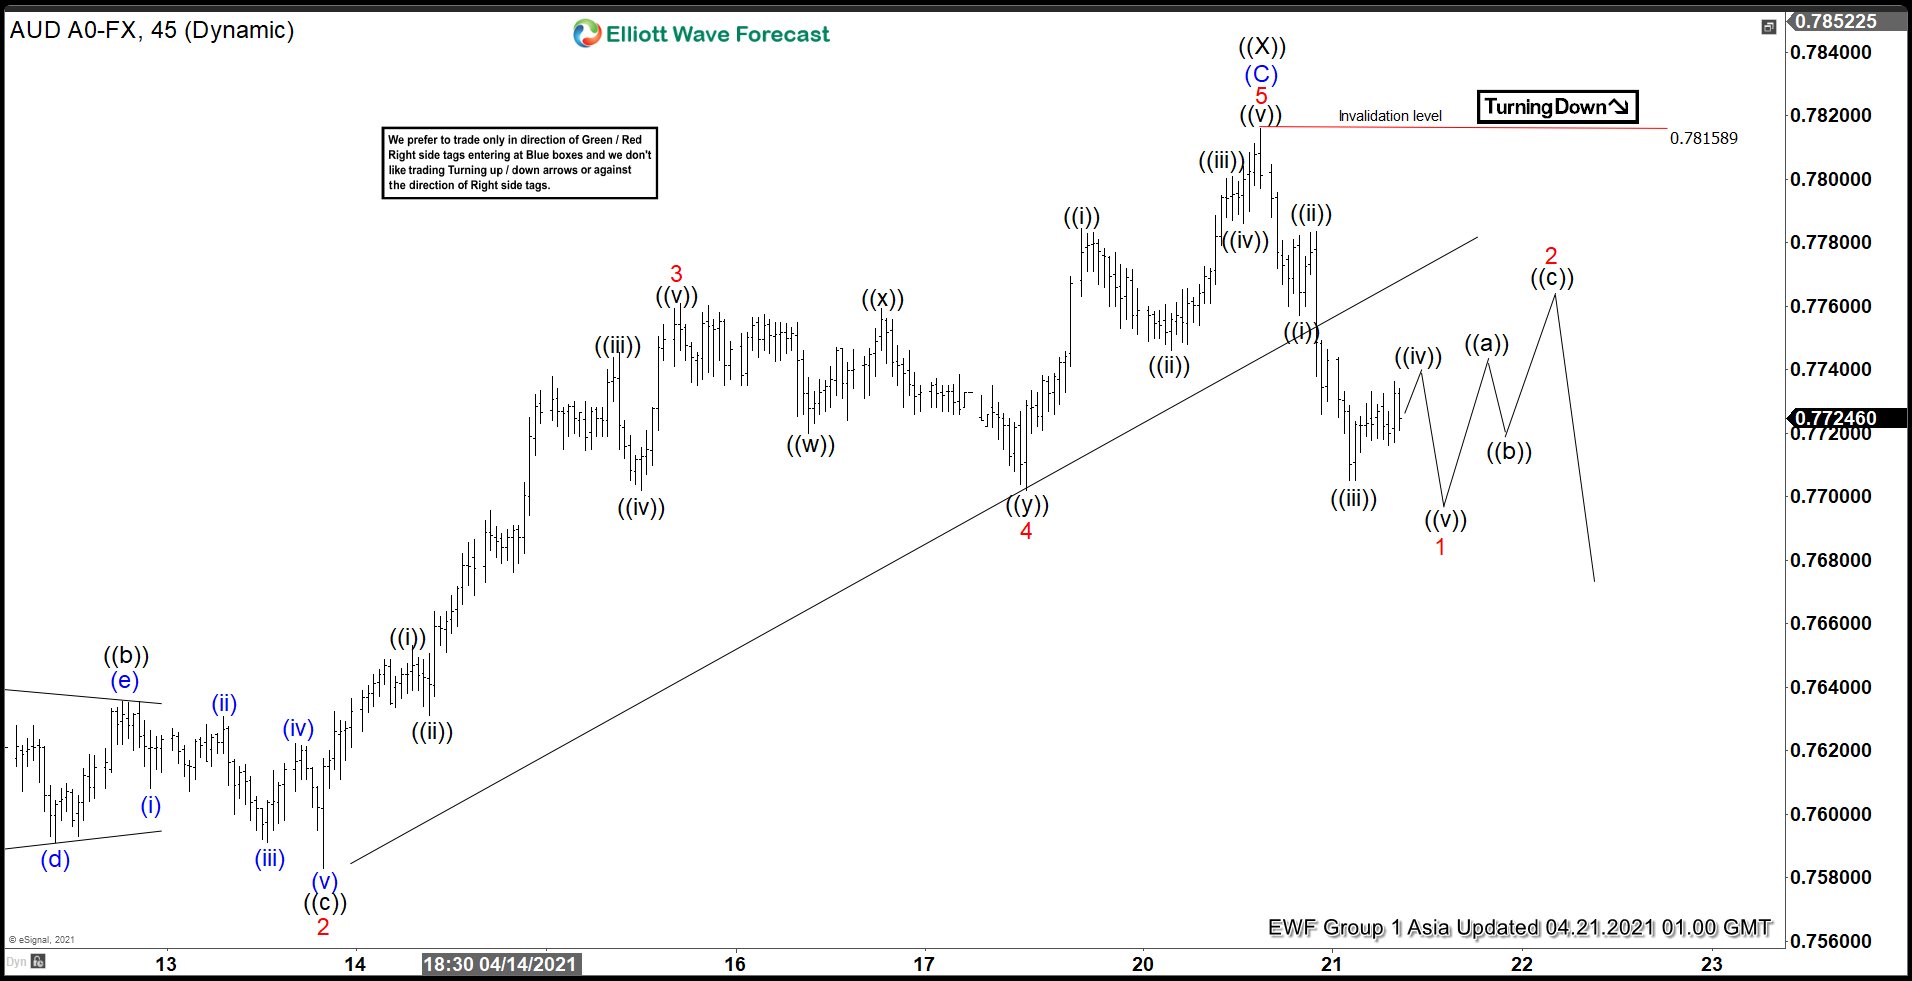
Short term Elliott wave view in AUDUSD suggests the rally from March 26 low ended as an expanded Flat Elliott Wave structure. Up from March 25 low, wave (A) ended at 0.7664 and wave (B) ended at 0.7528. Up from there, wave 1 of (C) ended at 0.7677 and wave 2 of (C) ended at 0.7583. The short term 45 minutes chart shows the rally starting from wave 2. Wave 3 of (C) ended at 0.7761, pullback in wave 4 of (C) ended at 0.7702 and final leg wave 5 of (C) ended at 0.7815. This also completed wave ((X)) in higher degree.
Pair has started to reverse lower. Down from wave ((X)), wave ((i)) ended at 0.7757 and wave ((ii)) bounce ended at 0.7783. Pair then extended lower in wave ((iii)) towards 0.7705. Rally in wave ((iv)) should fail for further downside in the pair to end wave ((v)) which should complete wave 1 in higher degree. Afterwards, pair should rally in wave 2 to correct the 5 waves down in wave 1 before the decline resumes. As far as pivot at 0.7815 remains intact, expect rally to fail in 3, 7, or 11 swing for more downside.


