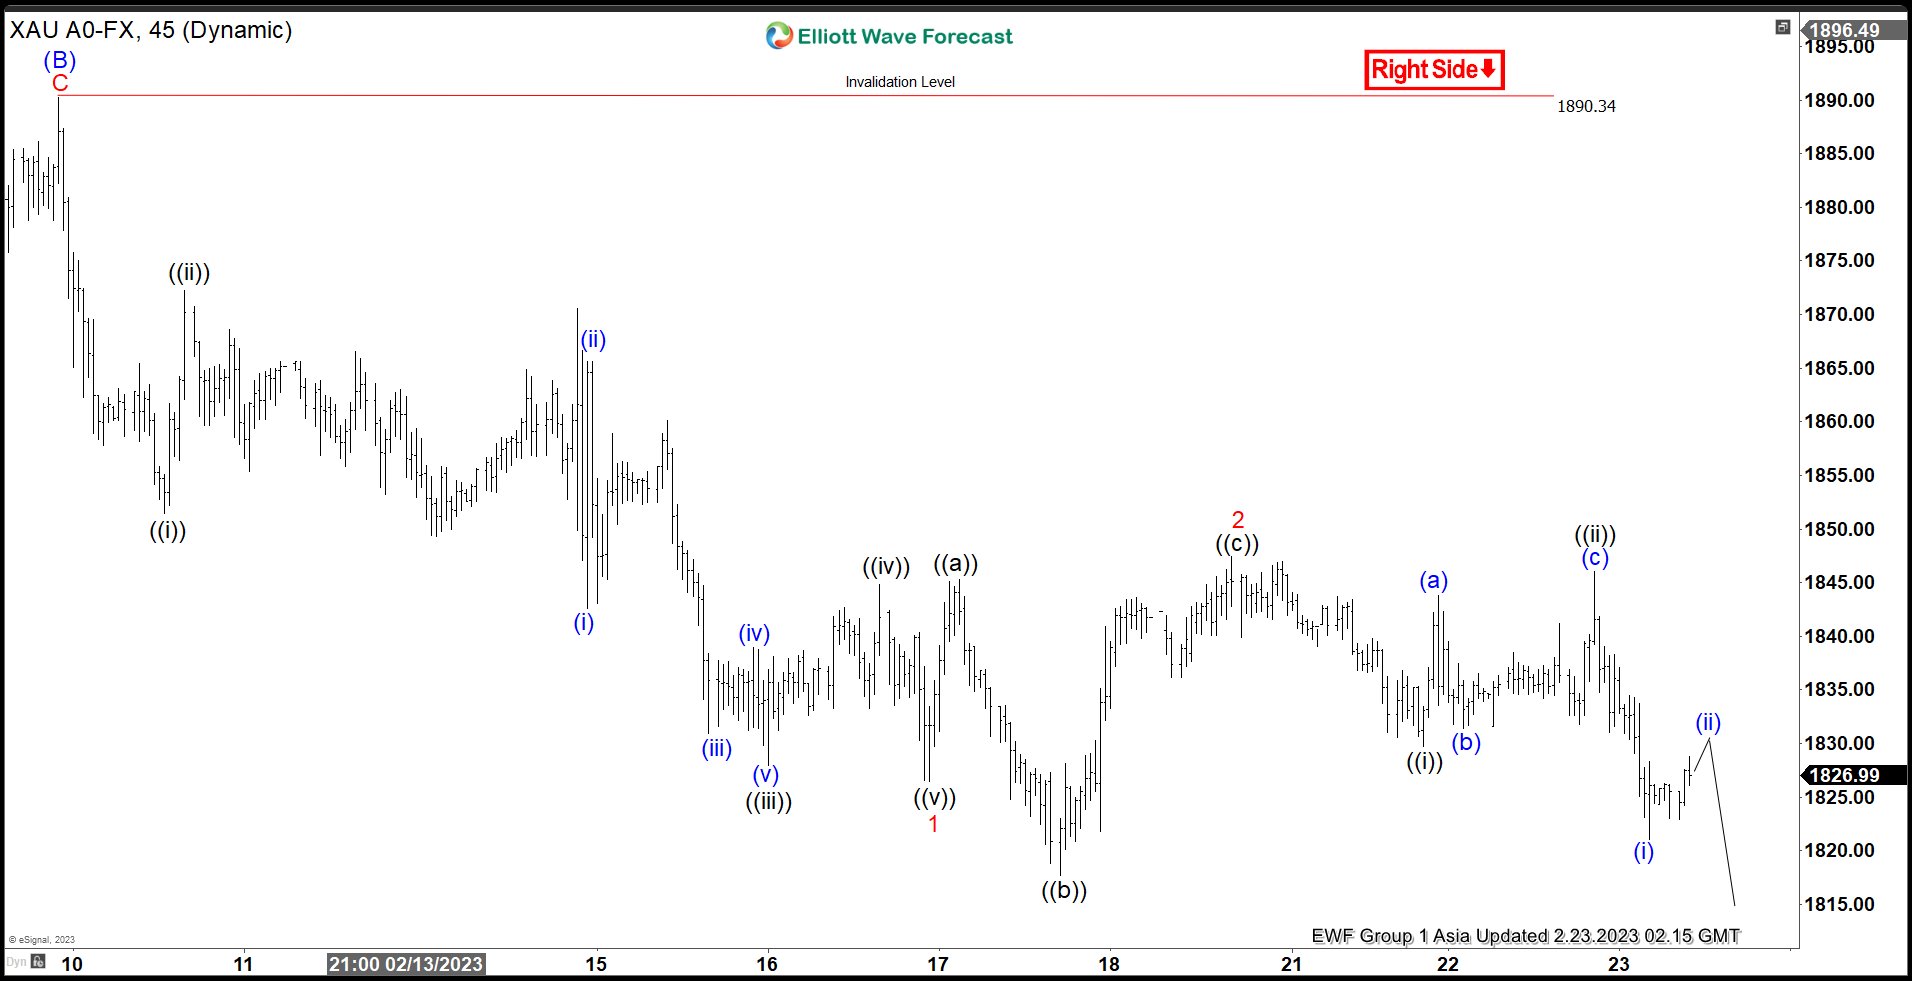
Since forming the low on September 28, 2022, Gold has rallied and the structure of the rally from 2022 low looks impulsive. It ended the rally on 2.2.2023 high at 1959.74. Since then, Gold has corrected lower. The correction takes the form of a zigzag Elliott Wave structure. Down from 2.2.2023 high, wave (A) ended at 1860.44. The 45 minutes chart below shows wave (B) rally which ended at 1890.34. The metal has resumed lower in wave (C) with subdivision as a 5 waves impulse.
Down from wave (B), wave ((i)) ended at 1851.5 and rally in wave ((ii)) ended at 1872.22. Wave ((iii)) ended at 1830.10, wave ((iv)) ended at 1844.84, and final leg wave ((v)) ended at 1826.50 which completed wave 1. Wave 2 rally took the form of an expanded Flat. Up from wave 1, wave ((a)) ended at 1845.29 and wave ((b)) ended at 1817.70. Wave ((c)) ended at 1847.45 which completed wave 2. The metal is currently in wave 3 of (C) lower. Down from wave 2, wave ((i)) ended at 1829.70 and wave ((ii)) ended at 1846.09. Near term, while rally fails below wave 2 at 1847.45 and more importantly below wave (B) at 1890.34, it still has scope to extend lower within wave (C).


