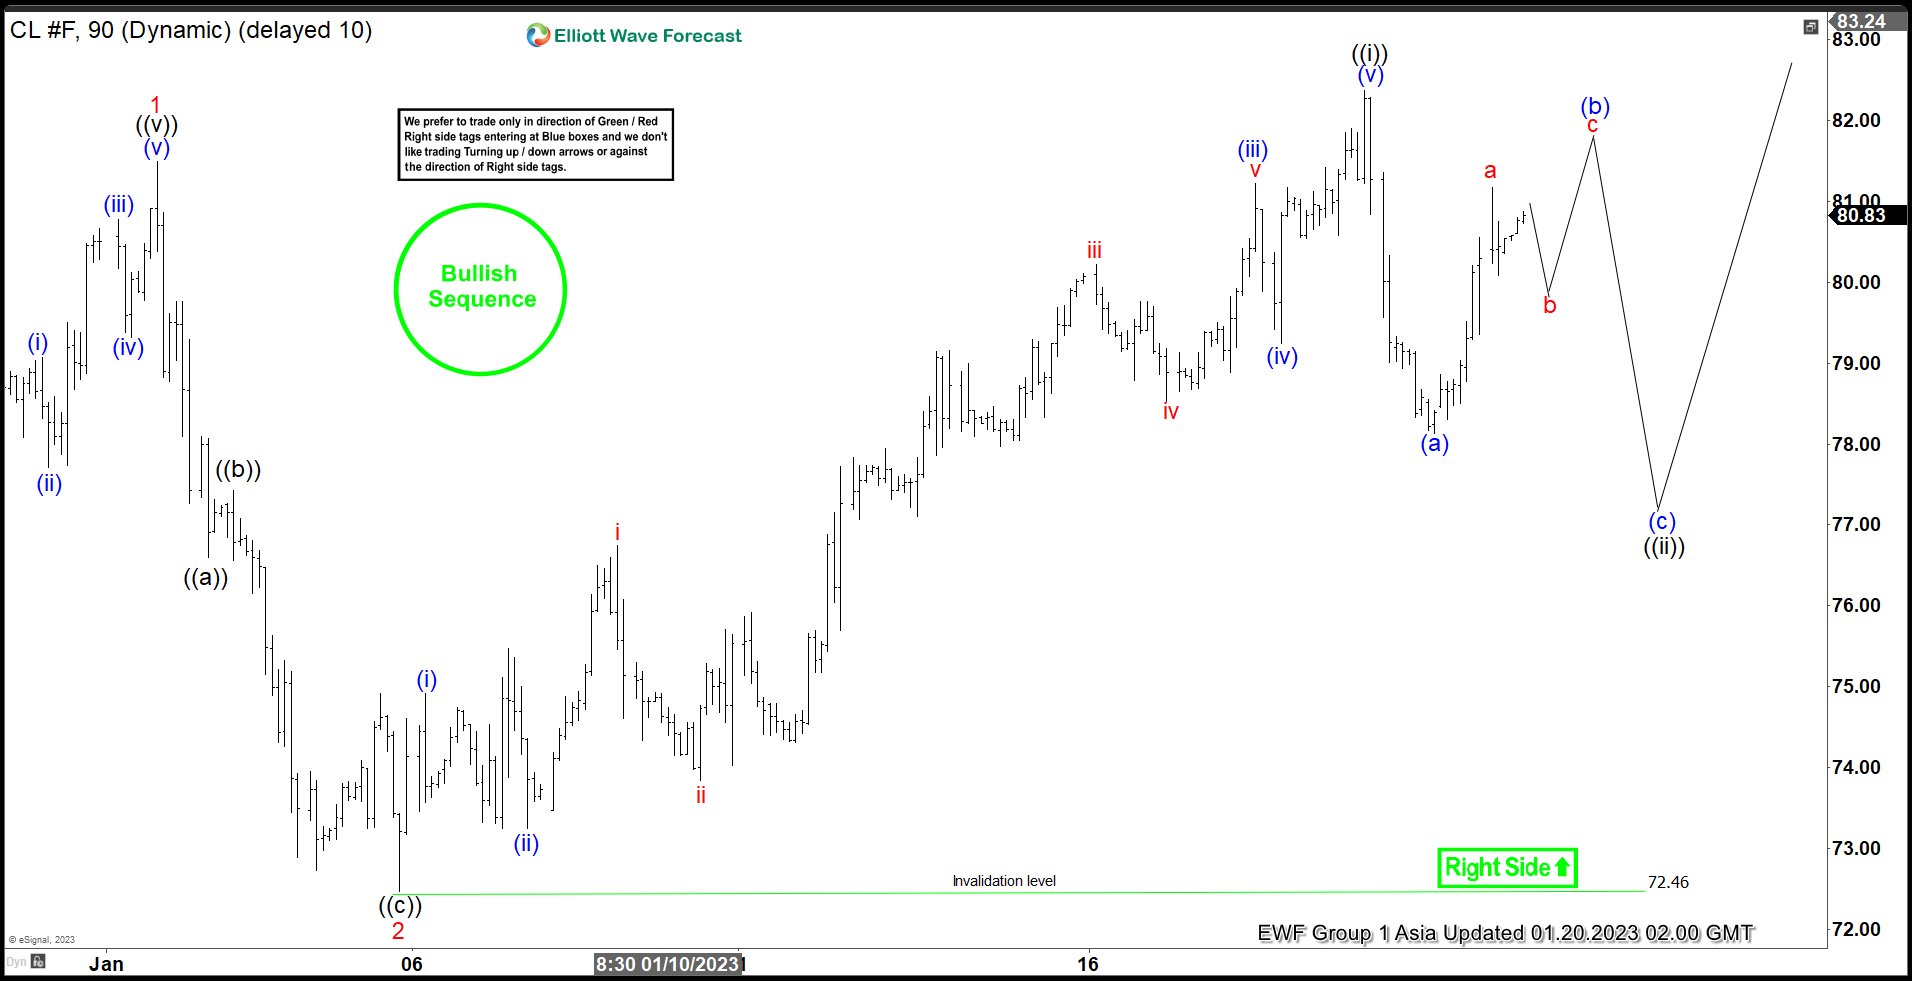
Oil shows a bullish sequence from 12.10.2022 low favoring further upside. Rally from there is unfolding as a 5 waves impulse Elliott Wave structure. Up from 12.10.2022 low, wave 1 ended at 81.50 and pullback in wave 2 ended at 72.46. Internal subdivision of wave 2 took the form of a zigzag structure as the chart below shows. Down from wave 1, wave ((a)) ended at 76.6, wave ((b)) ended at 77.42, and wave ((c)) ended at 72.46. This completed wave 2 in higher degree. Wave 3 higher is in progress with internal subdivision as another impulse in lesser degree.
Up from wave 2, wave (i) ended at 74.91 and dips in wave (ii) ended at 73.25. Oil then extends higher in wave (iii) towards 81.23, and dips in wave (iv) ended at 79.25. Final leg higher wave (v) ended at 82.38 which completed wave ((i)). Wave ((ii)) pullback is in progress with internal subdivision as a zigzag structure. Down from wave ((i)), wave (a) ended at 78.13. Expect a wave (b) rally followed by another turn lower in wave (c) to complete wave ((ii)) before the rally in Oil resumes.


