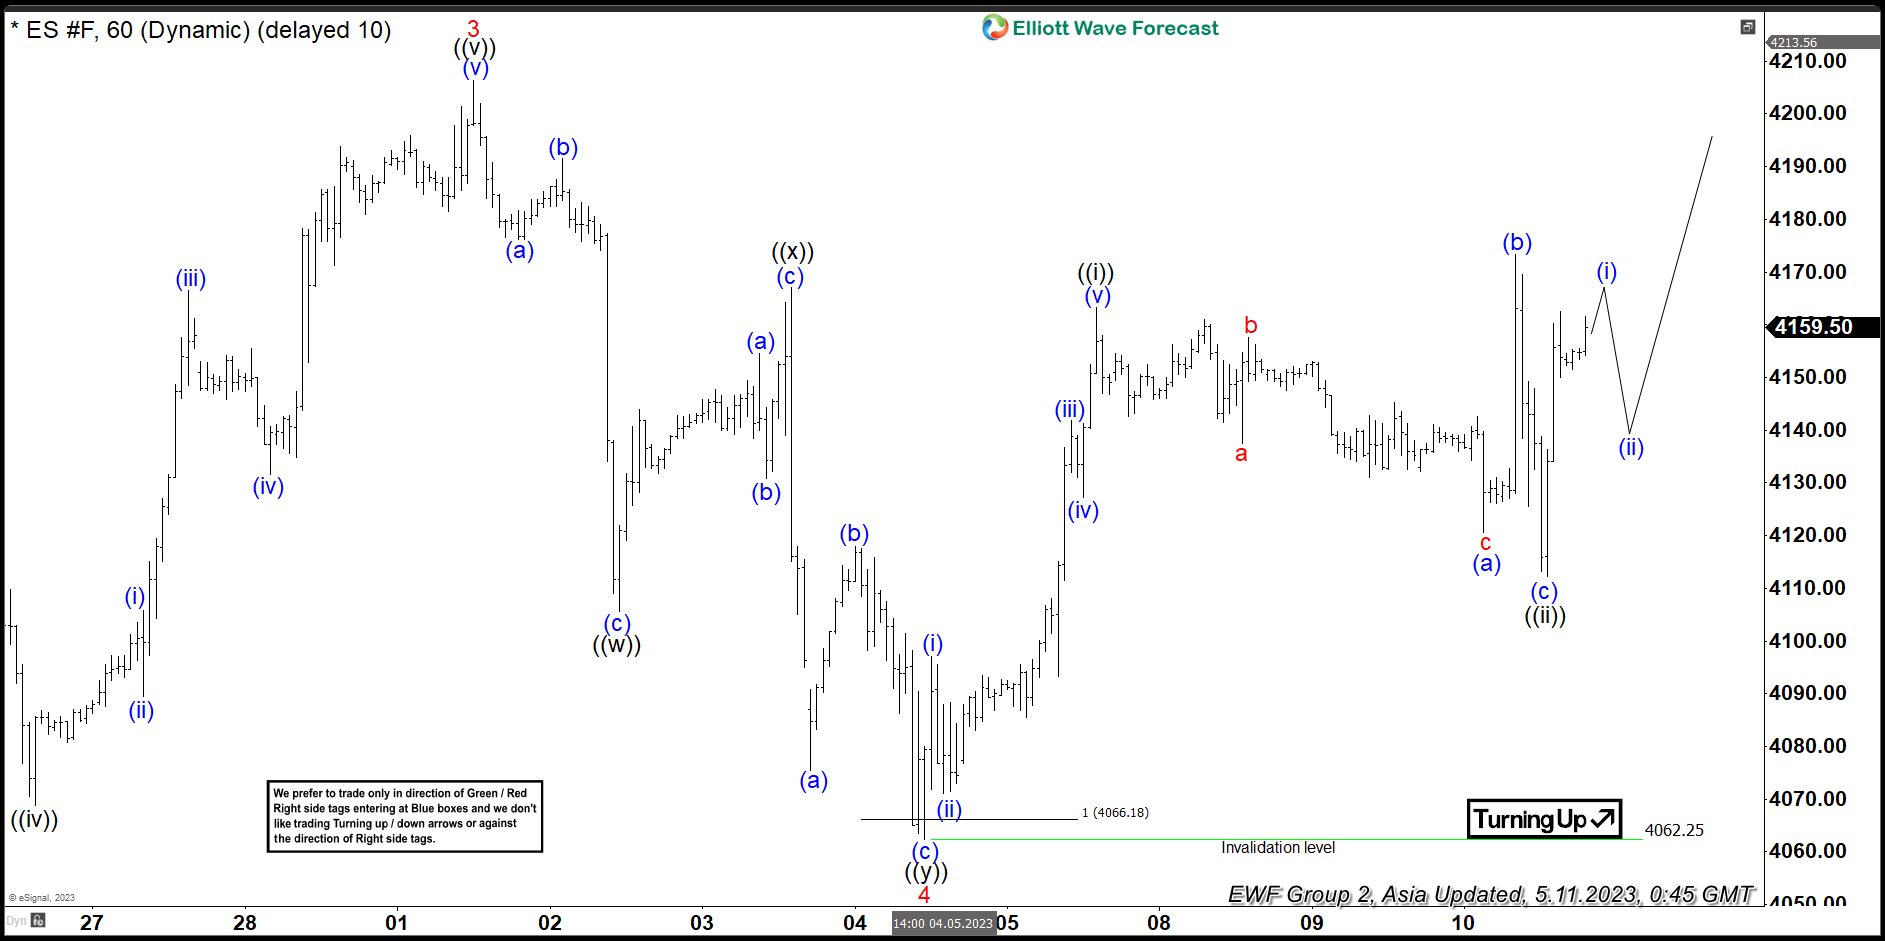
Short Term Elliott Wave View on S&P 500 E-Mini (ES) below shows that the Index ended wave 3 at 4206.25 and pullback in wave 4 is proposed complete at 4062.25. This view will get validation if the Index manages to break above wave 3. Internal subdivision of wave 4 unfolded as a double three Elliott Wave structure. Down from wave 3, wave (a) ended at 4176.25 and rally in wave (b) ended at 4191.50. Index resumed lower in wave (c) towards 4105.50 and this completed wave ((w)). Index then corrected in wave ((x)) towards 4167 with internal subdivision as a zigzag. Up from wave ((w)), wave (a) ended at 4154.5 and pullback in wave (b) ended at 4130.75. Wave (c) higher ended at 4167 which completed wave ((x)).
Index resumed lower again in wave ((y)) with internal subdivision as a zigzag. Down from wave ((x)), wave (a) ended at 4075.5 and wave (b) rally ended at 4118. Index then resumes lower in wave (c) towards 4062.25 which completed wave ((y)) of 4. Index has since turned higher in wave 5 with internal subdivision as a 5 waves impulse. Up from wave 4, wave ((i)) ended at 4163.25. Pullback in wave ((ii)) ended at 4112.25 with internal structure of an expanded flat Near term, as far as pivot at 4062.25 low stays intact, expect the Index to extend higher.


