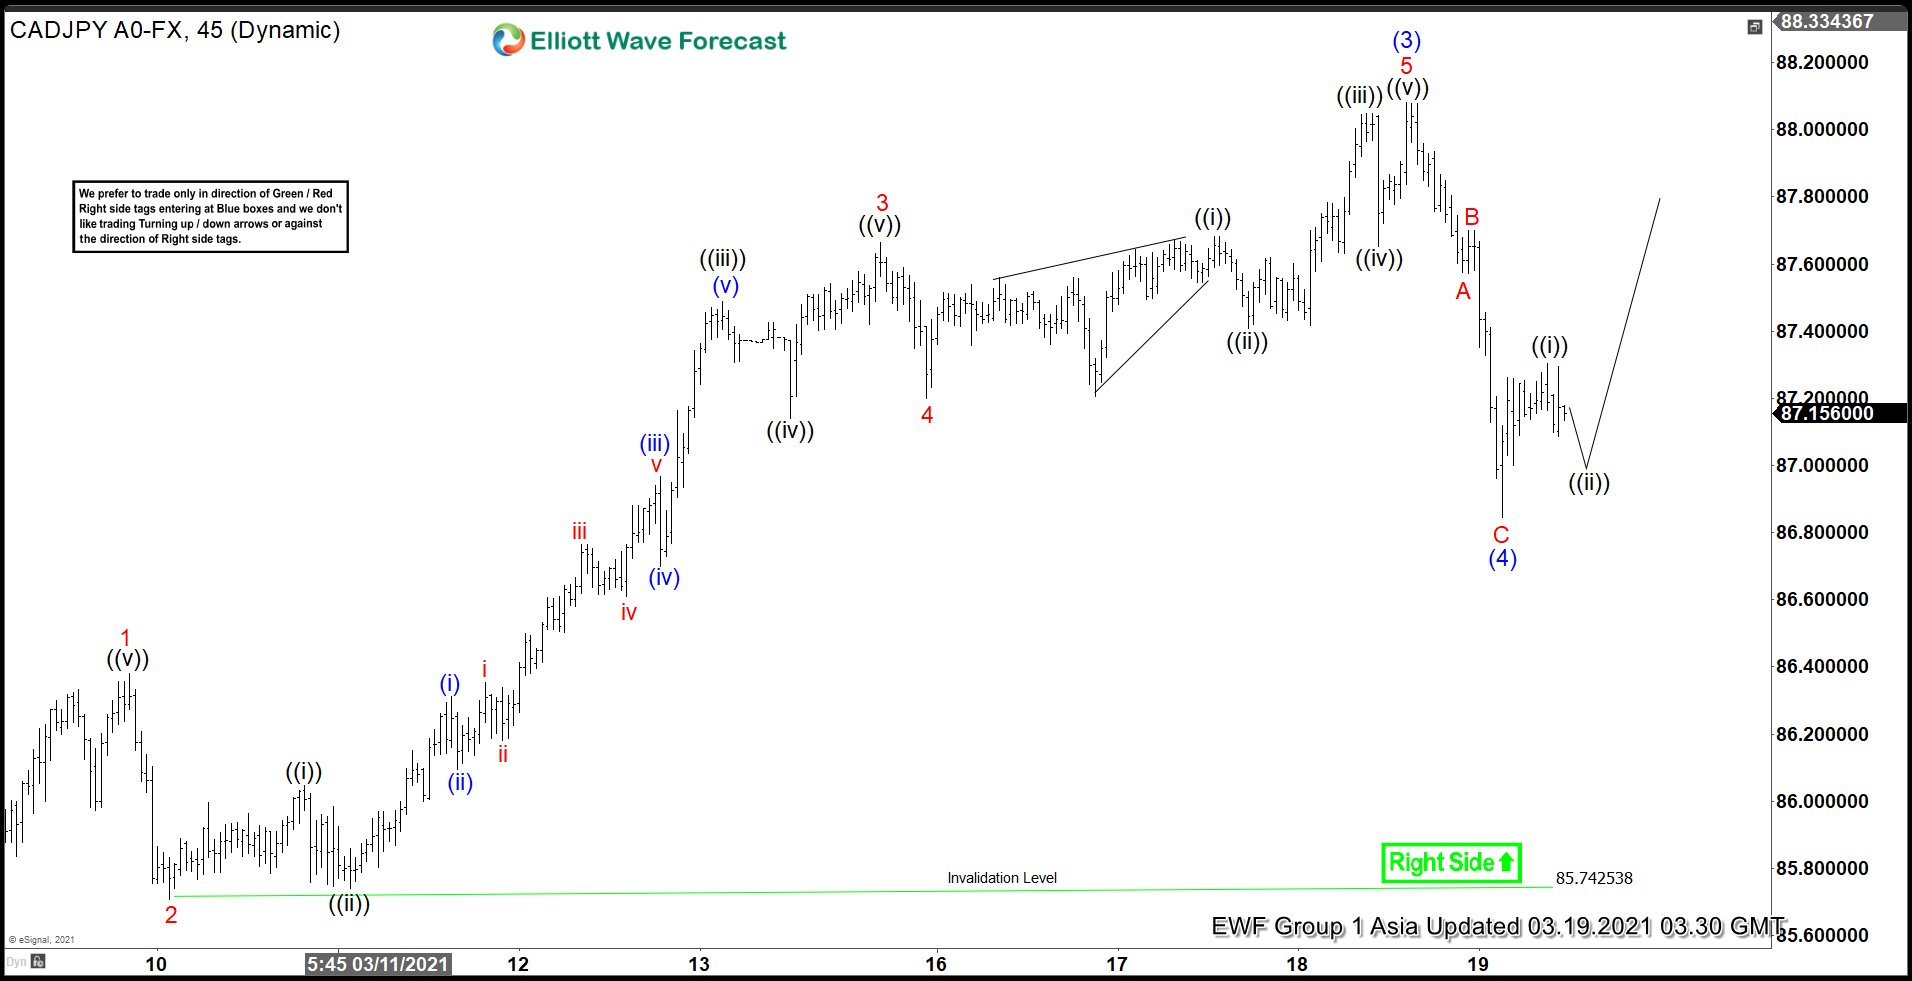
Short term Elliott Wave View suggests that rally from January 29 low is unfolding as a 5 waves impulse Elliott Wave structure. Up from January 29 low, wave (1) ended at 85.098 and pullback in wave (2) ended at 83.597. Pair then resumed higher and ended wave (3) at 88.082. Internal subdivision of wave (3) unfolded as impulse in lesser degree. Up from wave (2) low, wave 1 ended at 86.38 and wave 2 ended at 85.74. Wave 3 ended at 87.66, wave 4 ended at 87.2, and wave 5 of (3) completed at 88.082.
Wave (4) pullback is also proposed complete at 86.84 as the 45 minutes chart below shows. Currently wave (4) has reached 23.6 Fibonacci retracement of wave (3). Our guideline suggests wave (4) typically ends around 23.6 – 38.2% Fibonacci retracement of wave (3). In this case then, the minimum retracement has been met. However, until pair breaks above wave (3), we still can’t rule out a double correction in wave (4).
Minimum potential target for wave (5) in this case will be 123.6 – 161.8% external Fibonacci retracement of wave (4) which comes at 88.36 – 88.83. For another way to measure wave (5) target, we can also use 100% – 161.8% Fibonacci extension technique where wave (5) = wave (1) at 90.93 – 93.43.


