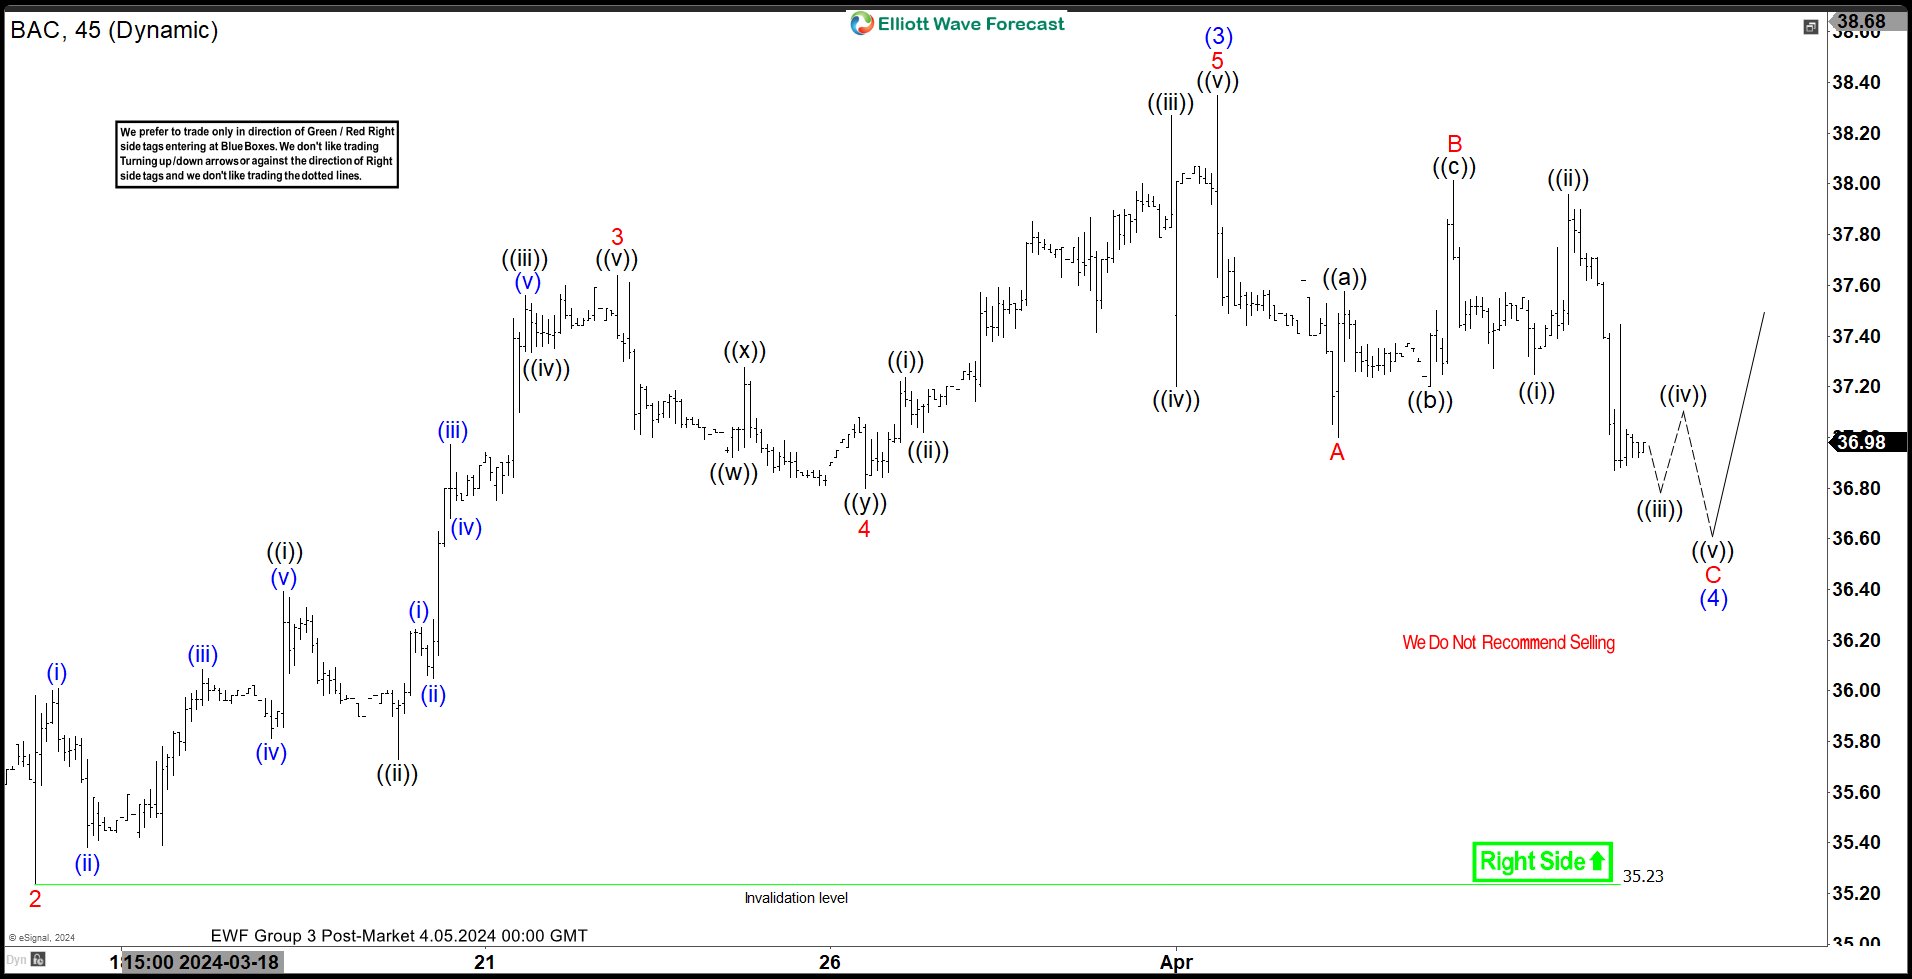
Elliott Wave Structure in Bank of America (BAC) shows incomplete bullish sequence from 10.27.2023 low favoring further upside. Short Term, rally from 1.17.2024 low is unfolding as a 5 waves impulse Elliott Wave structure. Up from there, wave (1) ended at 35.1 and dips in wave (2) ended at 32.35. The stock extends higher again in wave (3). Up from wave (2), wave 1 ended at 36.45 and pullback in wave 2 ended at 35.24. The stock extended higher again in wave 3 towards 37.64 and pullback in wave 4 ended at 36.8. Final leg wave 5 ended at 38.35 which completed wave (3).
The stock is now pulling back in wave (4) with internal subdivision as a zigzag structure. Down from wave (3), wave A ended at 37 and rally in wave B ended at 38.02. Wave C lower is in progress and can see further downside as a 5 waves. Down from wave B, wave ((i)) ended at 37.25 and wave ((ii)) ended at 37.96. Wave C target can reach 100% – 161.8% Fibonacci extension of wave A. This area comes at 35.85 -36.68. From this area, the stock can see buyers for further upside or 3 waves rally at least.


