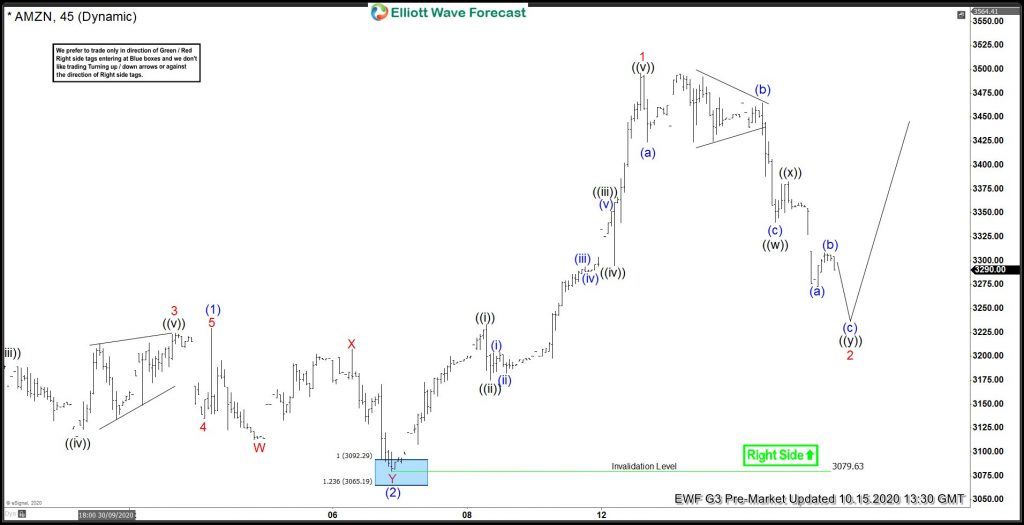
Elliott wave view in Amazon ticker symbol: $AMZN rally from 21 September 2020 low is showing a higher high sequence favoring more upside. The rally higher is nesting as an impulse structure when wave (1) ended in 5 waves at $3229.31 high. Down from there, wave (2) pullback in Amazon unfolded as double three structure where wave ((w)) ended at 3113.02 low. Wave ((x)) bounce ended at $3207.19 high and wave ((y)) ended at $3079.63 low.
Amazon Updated View:
Amazon 1 Hour Elliott Wave Chart
Up from there, the rally took place in another 5 waves impulse structure where wave ((i)) ended at $3233.29 high. Wave ((ii)) ended at $3174.99 low, wave ((iii)) ended at $3352.31 high, wave ((iv)) ended at $3294.86 low and wave ((v)) ended at $3496.24 high thus completed wave 1. Below from there, the stock is doing a wave 2 pullback to correct the cycle from the 10/06/2020 low ( $3079.63). The internals of that pullback is unfolding as a double three structure where wave ((w)) ended at $3340 low. Wave ((x)) bounce ended at $3382.50 high and wave ((y)) is looking to extend lower towards $3226.01- $3129.42 100%-161.8% Fibonacci extension area of ((w))-((x)). Then from there, the stock is expected to resume higher or should produce a 3 wave bounce at least.
Back

