An interesting pair to look at to identify the path of the USDX after 9.28.22 peak is the USDCHF. We all know and seen the USDX rallying within wave ((3)) during the last 1 and a half years. The cycle now is getting mature and expected pullback was inevitable.
At Elliott Wave Forecast, as an analyst and a professional trader you need to look at different clues in the market that may help you determine a cycle or a sequence. This will allow you to figure out a possible path so you can be able to execute reasonably your trading plan ahead. The market always reacts within the transactions being made between buyers and sellers. For a market to exist you need to have both sides.
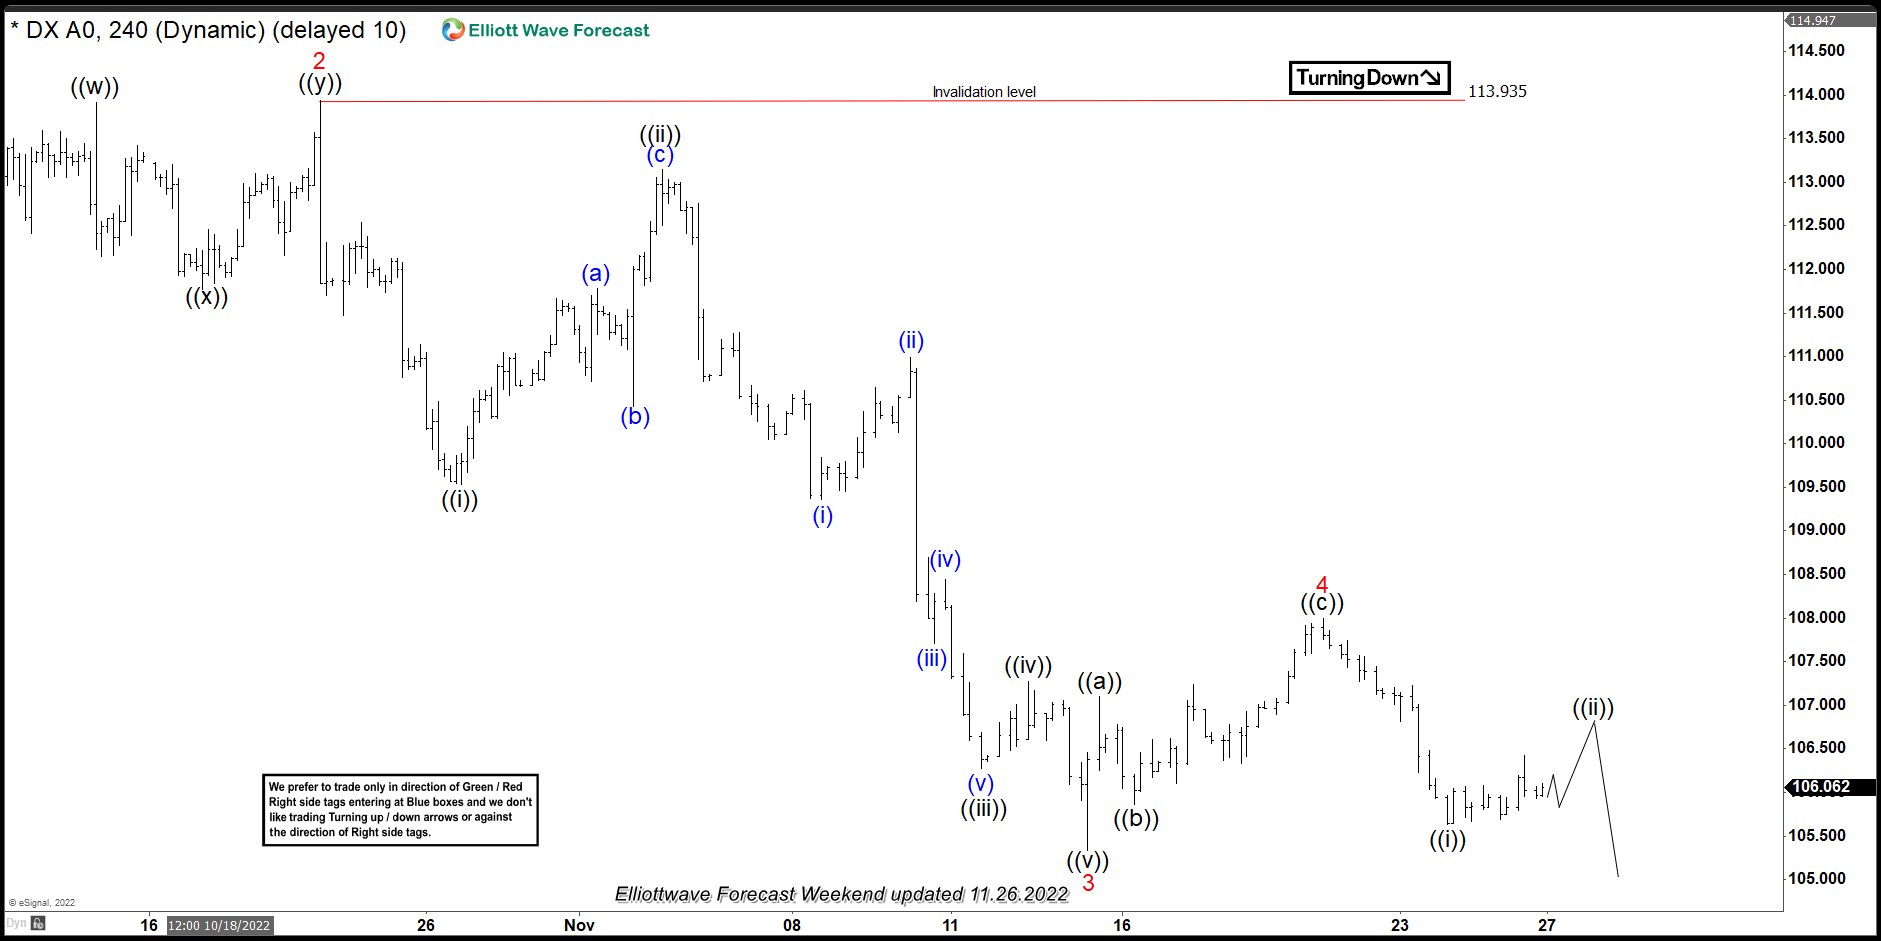
If you ever seen an exchange you know that you can see how much money is available at a specific price. Either for buying or selling an asset. This however is not available within the retail trading industry within the Forex markets. Our system is able to combine Elliott Wave theory with the addition of market correlation and distribution. And looking at the sequences among other things to determine the most probable and accurate path. Let’s have a look at the USDX 11.26.22 4 hour weekend update.
USDX 11.26.22 4 Hour weekend update
We can see that wave 2 red in the USDX was at 10.21.22 and from there made 5 waves lower into wave 3 before bouncing in wave 4 and then lower in wave 5 takes place. Now let’s have a look at what the USDCHF has done.
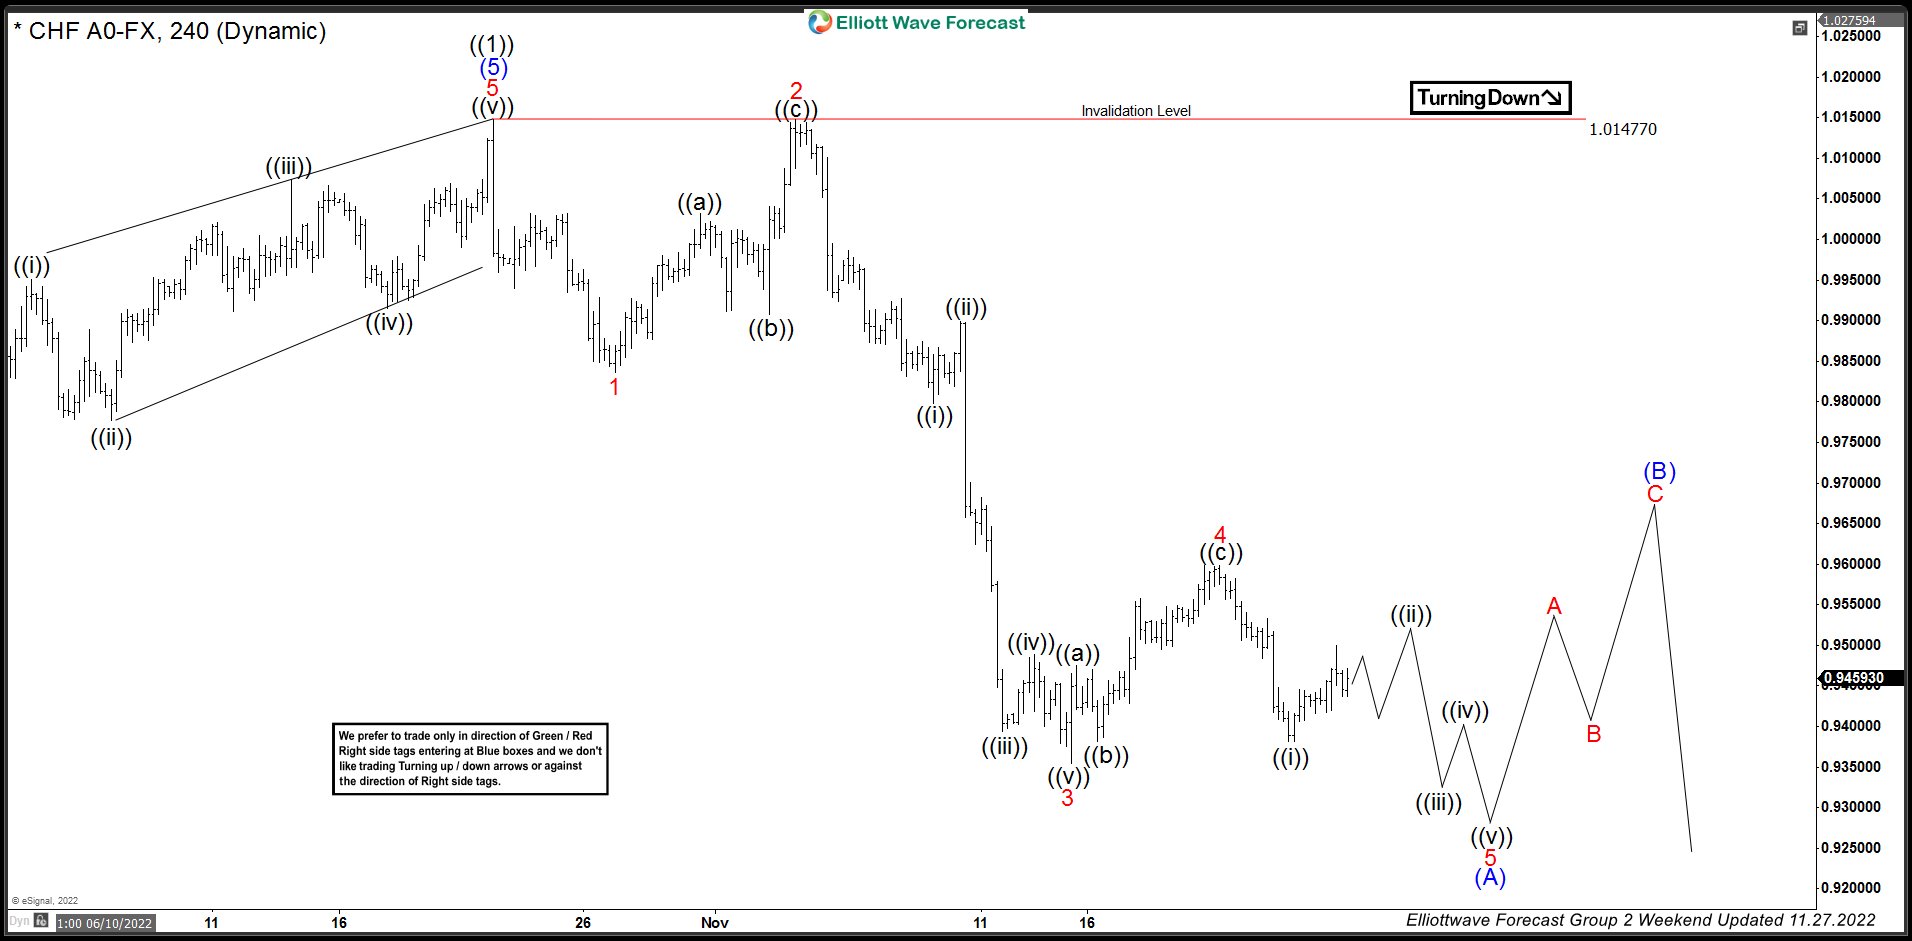
USDCHF 11.27.22 4 Hour weekend update
The USDCHF as we can see ended its cycle at 10.21.22 the same date that the USDX ended wave 2 red. From that point on the 2 instruments are correlated within the same cycle and path. Before ending the cycle and soon to start the bounce. Now let’s have a look at the latest charts from both instruments.
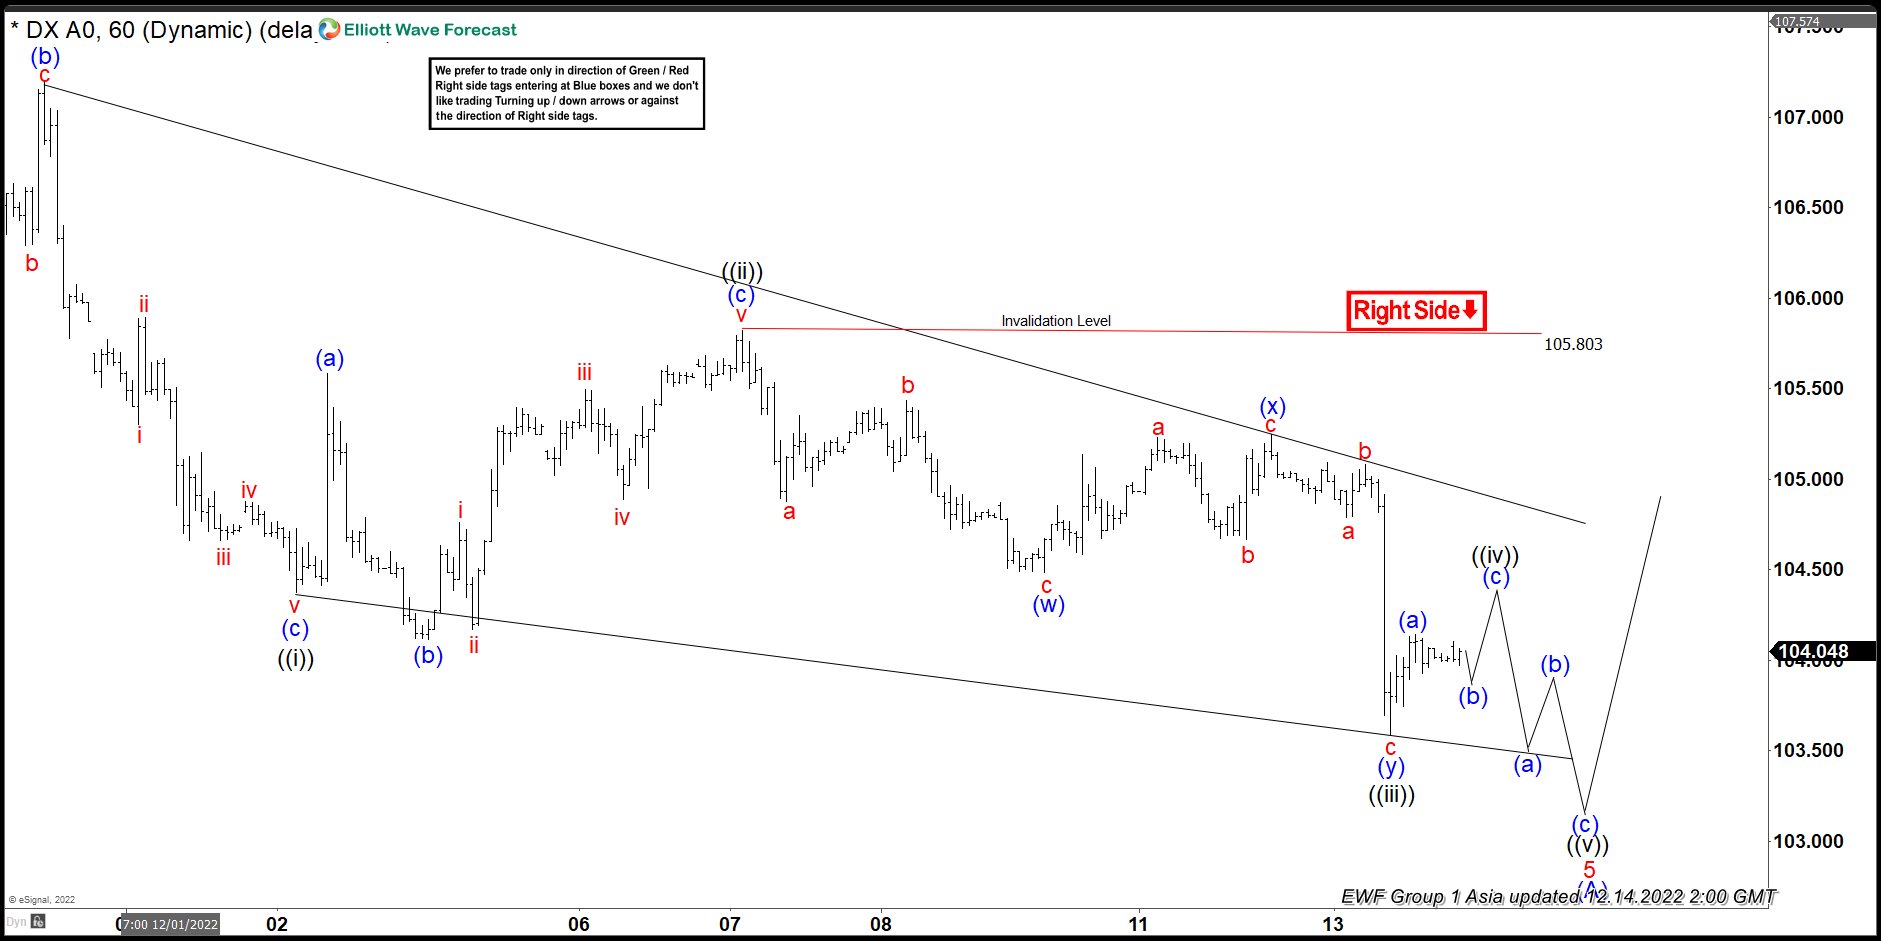
USDX 12.14.22 1 hour Asian update
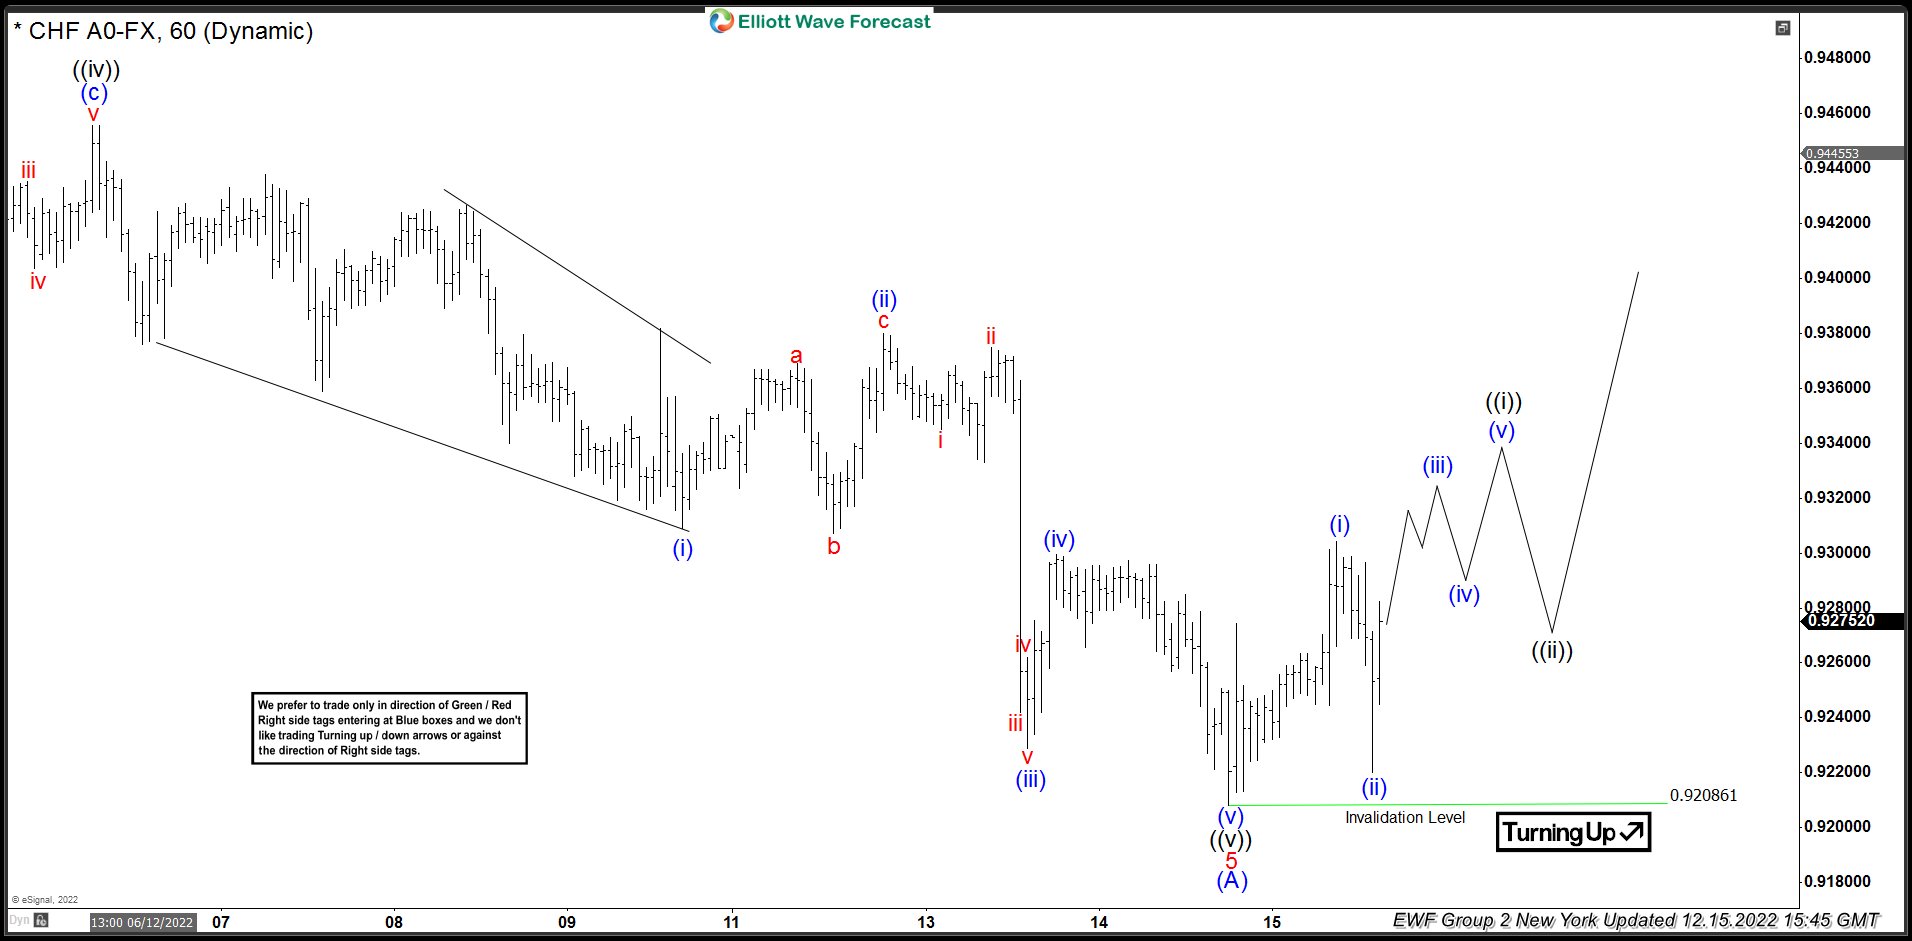
USDCHF 12.15.22 1 hour New York Update
As we can see both instruments shared a similar path. This is because within a cycle we usually have some instruments that we can relate to. It gives us clues as to how and when a cycle might be ending. Most times we find instruments that we can relate that have identical swing counts and structure. We use multiple indicators to be able to accurately forecast the market. Alongside our distribution system, sequence and correlations amongst others.
Take advantage of our knowledge and expertise here at Elliott Wave Forecast and get daily market updates alongside Live analysis sessions where you can ask live questions. In addition, our live trading rooms where we share trading setups in accordance with our blue box and sequence system.
Join today for a 14 day trial with no commitment to renew and see for yourself Elliott Wave Forecast Trial Plan Page


