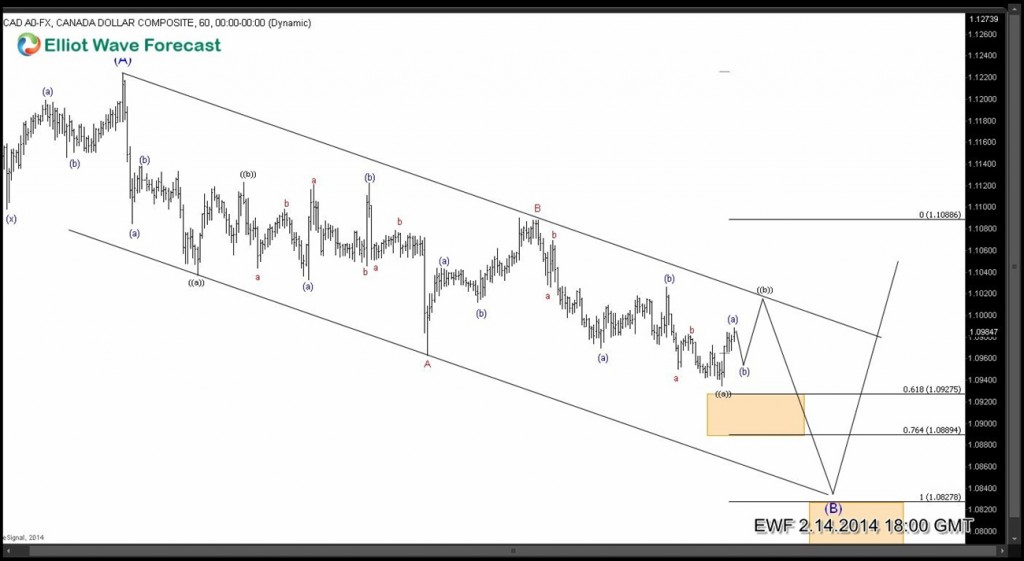
Let’s take a look at USDCAD price action from 1.1225 (1.31.2014). Drop from 1.1225 – 1.0968 was a corrective decline and has been sub-divided in 3 larger 3 swings labelled (( a )) – (( b )) and A. Pair attempted to rally and failed almost at 50% fib retracement of the drop from 1.1225 high. Sellers jumped back in the market and pushed price to new lows below 1.0968 and we now have 5 swings down from 1.1225 peak which is an incomplete swing sequence.
Earlier today, we saw the pair bouncing from 0.618 ext of wave A, so we believe we are in 6th swing now i.e. wave (( b )) which can reach as high as 1.1016 – 1.1034 (test 1 hour descending trend line) before pair turns lower in 7th swing. Orange area (1.0766 – 1.0828) highlights the inflection area where the 7 swing move is expected to end because we believe sellers will take profit there and buyers will step in the market which will produce a bounce in the pair either to new highs above 1.1225 or at least a correction of the entire decline from 1.1225 giving traders an opportunity to create a risk FREE position.
Back

