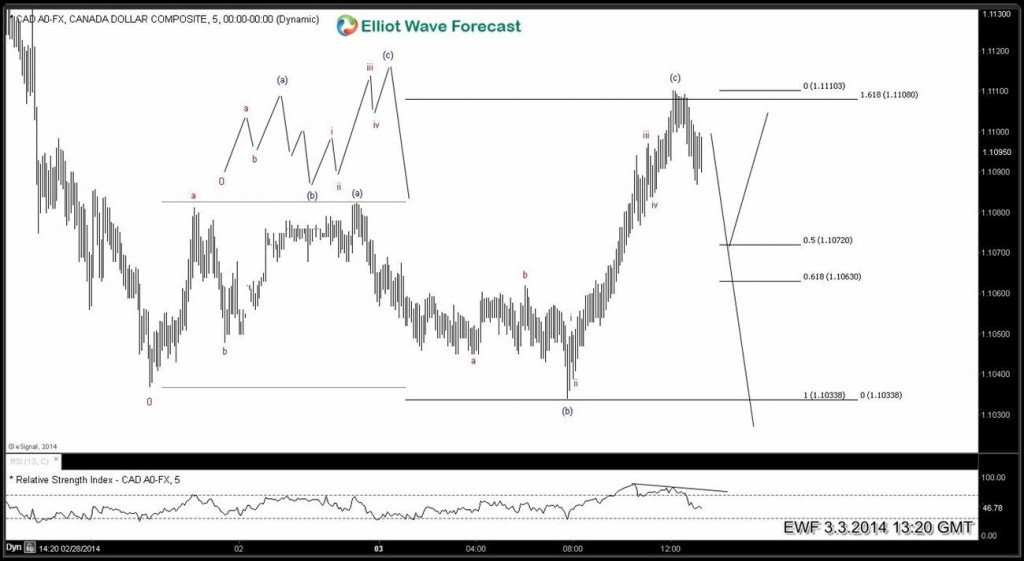
USDCAD 5 min chart is showing a possible FLAT structure which is a 3-3-5 structure. We have 3 waves up from 1.1037 – 1.1082 and 3 waves down to 1.1033. After that we can count 5 waves up to 1.1110 level with divergence in RSI. As far as RSI divergence remains intact and price stays below 1.1110 level, we can expect more downside in the pair.
If pair indeed did a FLAT correction, then expect it to drop to new lows below 1.1033 and if 5 waves up was start of a new cycle i.e. wave ( a) / ( i ). Then pair do 3 waves lower and turn higher from 1.1063 – 1.1072 region.
Receive accurate & time forecasts of 25 instruments in 4 time frames with 1 hour charts updated 4 times a day. Trading is not an easy job, you need someone to keep you on right side of the market. Click HERE to start your 14 day Trial and learn to trade on right side of market with EWF
Back

