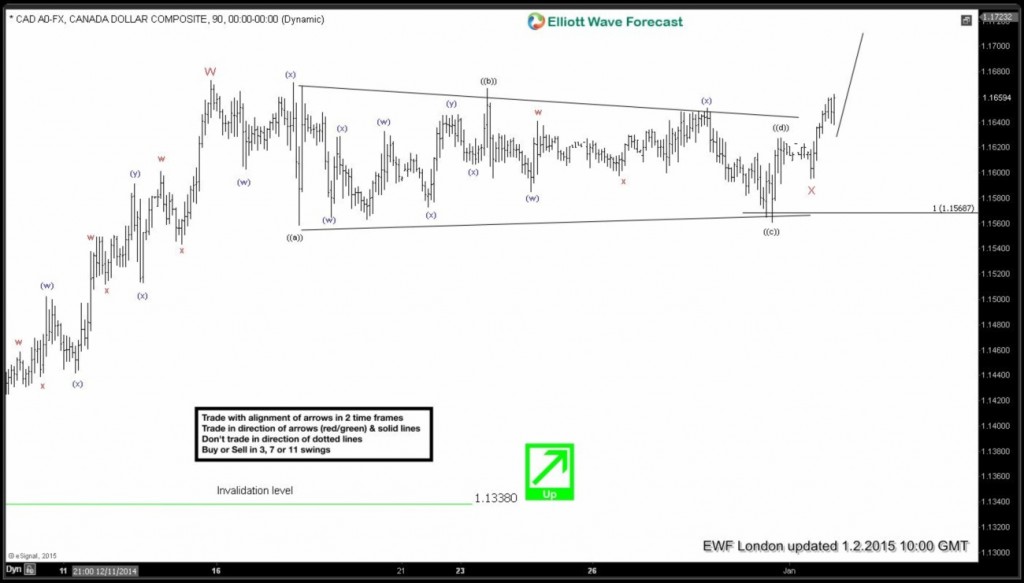
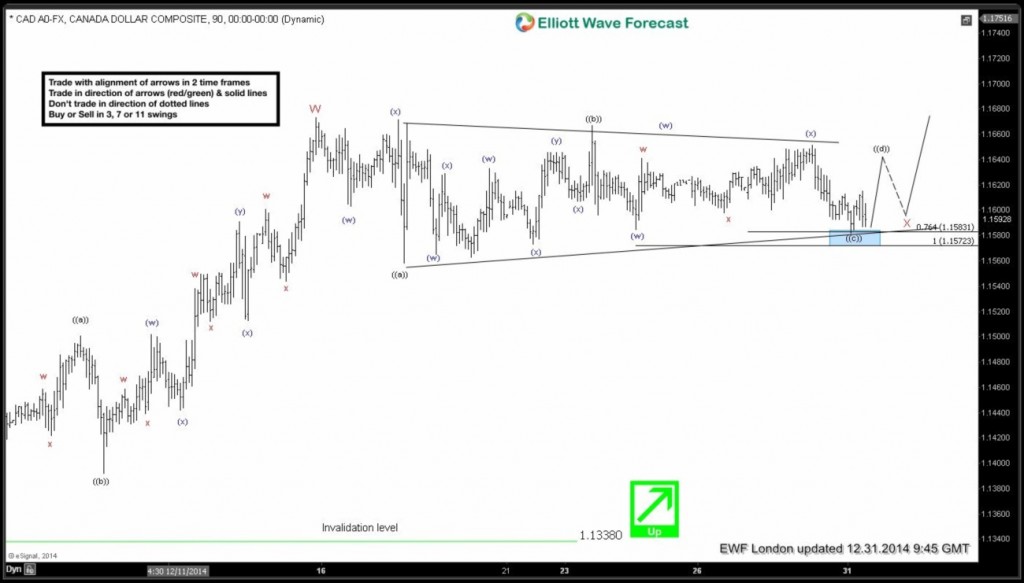
At the end of December 2014. USDCAD was doing bullish triangle in wave X connector. Wave ((c)) of triangle reached important technical area at 1.1583-1.1572 and rally was expected from there.
We suggested our members to play long side in this pair against wave (( a )) of the triangle low at 1.5559. This was the more aggressive view, if Elliottwave triangle had failed, we would still be buyers at lower levels in the sequence of 3, 7 or 11 swings as far as bullish pivot (indicated with a green arrow) at 1.3338 low remained intact in our system.
Let’s take a look at H1 Elliott Wave charts from the 31. December 2014 to see how we were guiding our members through the USDCAD price structure.
USDCAD December 31/2014 (London Update) Wave ((c)) of triangle has reached 1.1583-1.1572 area. We expect rally in wave ((d)) from there.
USDCAD January 2/2015 (London Update) X connector is done as Triangle structure @ 1.1595 and further rally should resume.
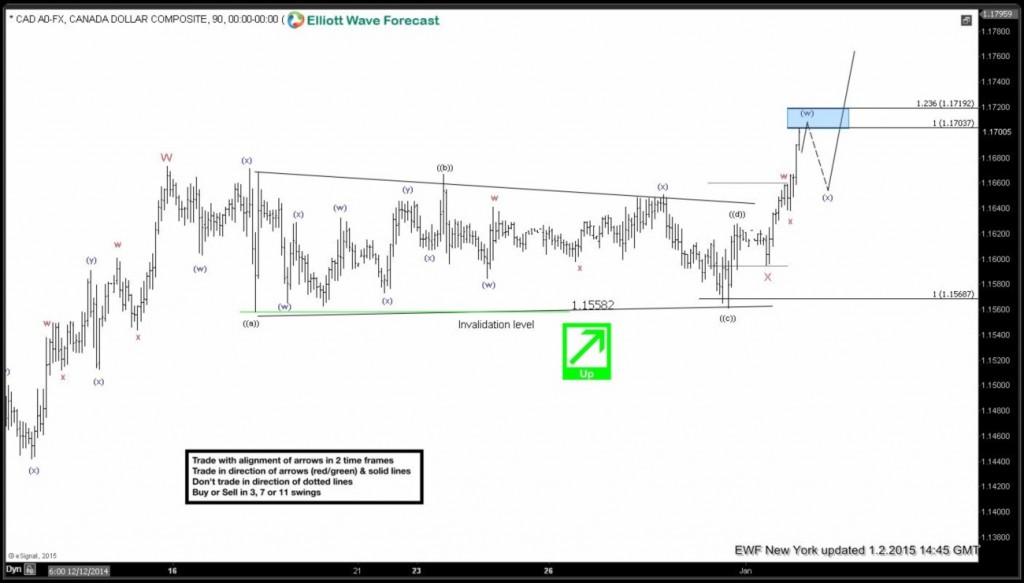
USDCAD January 2/2015 (NY Update)
The price is approaching short term equal legs-1.236 fib extension area @1.17037-1.17192 from where it might give us pull back before resumes higher.
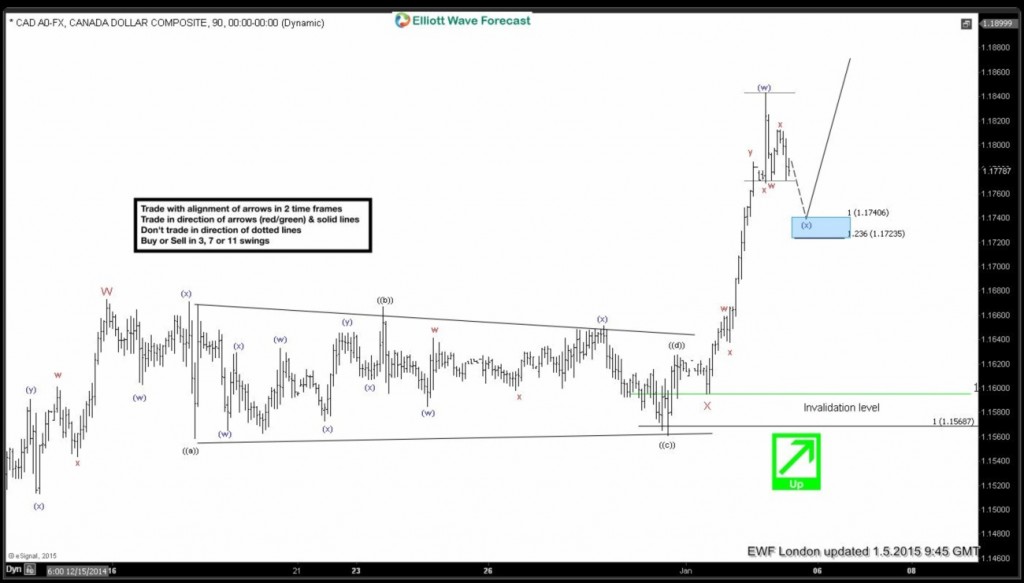
USDCAD January 5/2015 (London Update) Wave (w) has extended little bit higher, and now we’re getting (x) pull back, equal legs area comes at 1.17406-1.17235 (potential buy zone). Pull back is expected to reach that area before rally resumes toward new highs.
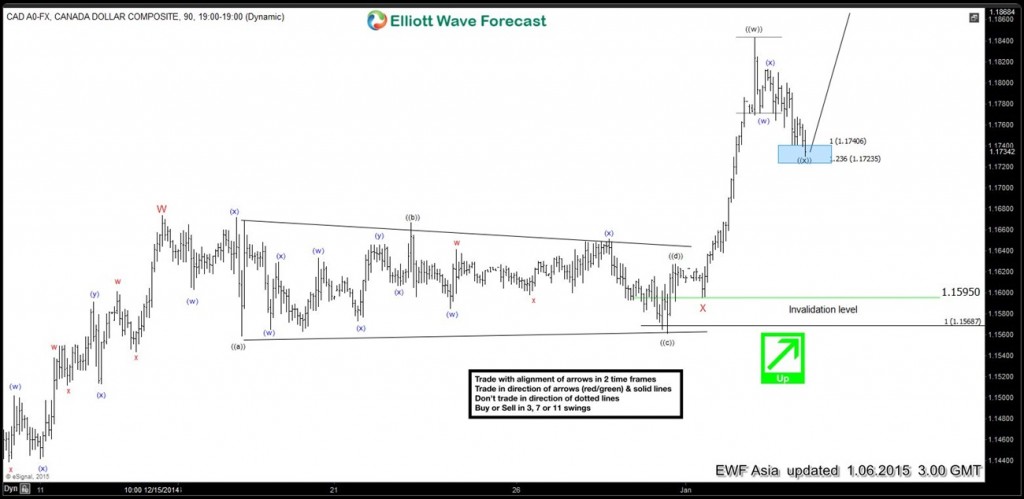
USDCAD January 6/2015 (Asia Update) Equal legs area has been reached, as predicted. We advised our members to play long side against 1.1595.
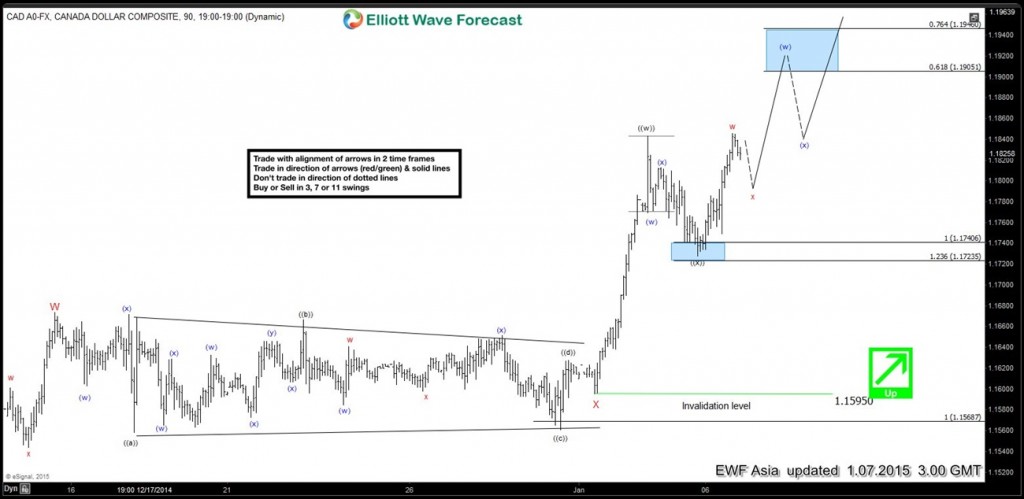
USDCAD January 7/2015 (Asia Update) We got nice reaction higher, short term pull back is expected before rally resumes toward next area of interest @ 1.19051-1.19460 area.
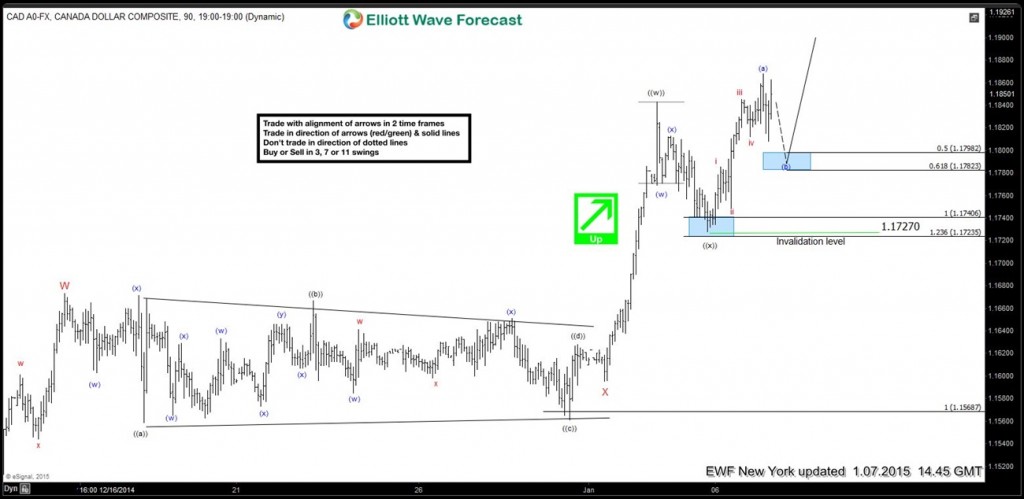
USDCAD January 7/2015 (NY Update) Pull back (b) is in progress toward 50-61.8 fib ret area @ 1.17982-1.17823 (new buying zone). View is bullish against pivot @ 1.1727 low.
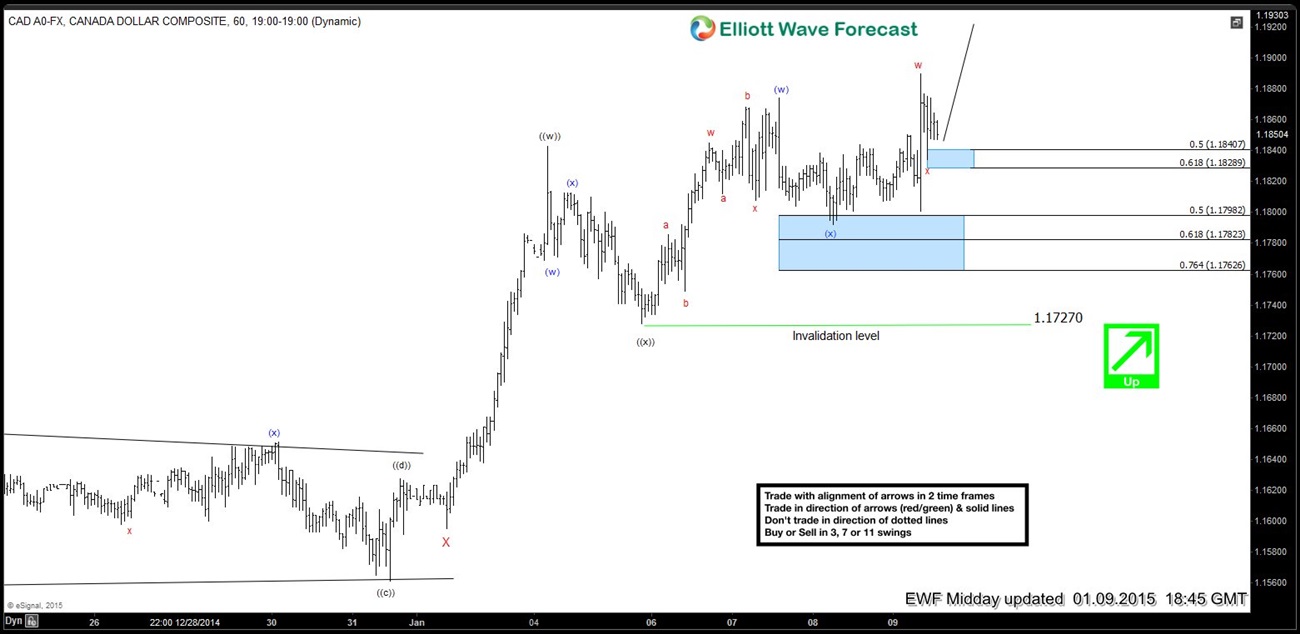
USDCAD January 9/2015 (NY- Mid day Update) The pair turned higher from 50 fibs and gave us new high. Chart suggests we’re in short term pull back x which could give us 50-61.8 fib zone @ 1.18407-1.18289 before rally resumes.
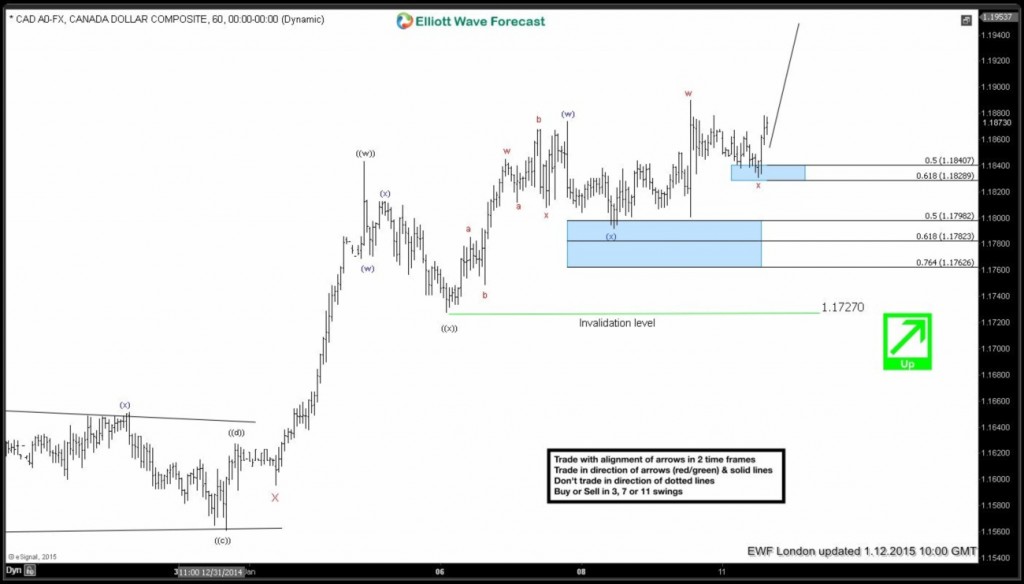
USDCAD January 12/2015 (London Update) 50-61.8 fib zone is reached & X pullback is in place @1.1833, further rally is expected to resume…
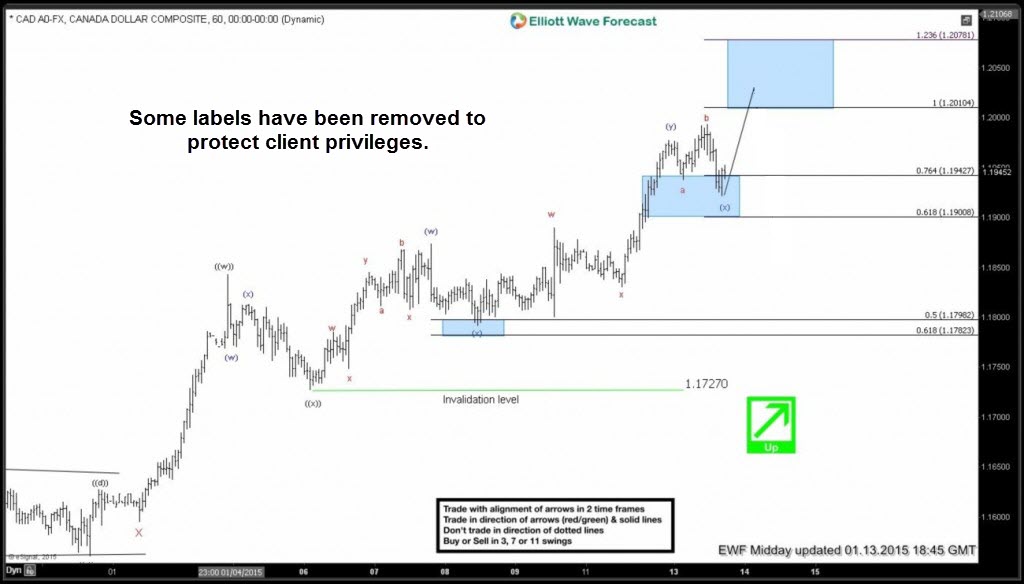
USDCAD January 13/2015 (NY Mid day Update) (x) pull back has ended as Flat structure@ 1.1924 . Chart suggests we’re in triple three from the 1.1727 low & another extension
is expected at least toward 1.20104.
If you would like to have access of EWF analysis in real time, feel free to join us. Now You have an opportunity to sign up for 14 Days Trial here and get Full acces of Premium Plus Plan in 2 weeks. We provide Elliott Wave charts in 4 different time frames, 2 live webinars by our expert analysts every day, 24 hour chat room, market overview,daily and weekly technical videos and much more.
If you want to improve your Elliott Wave analysis and Trading Execution Skills, we advise you to check 3 Educational seminar recordings , you will learn a lot from our Market Experts. As our member you’ll get discount on them.
More information about subscription plans can be found here . Welcome to EWF !
Back