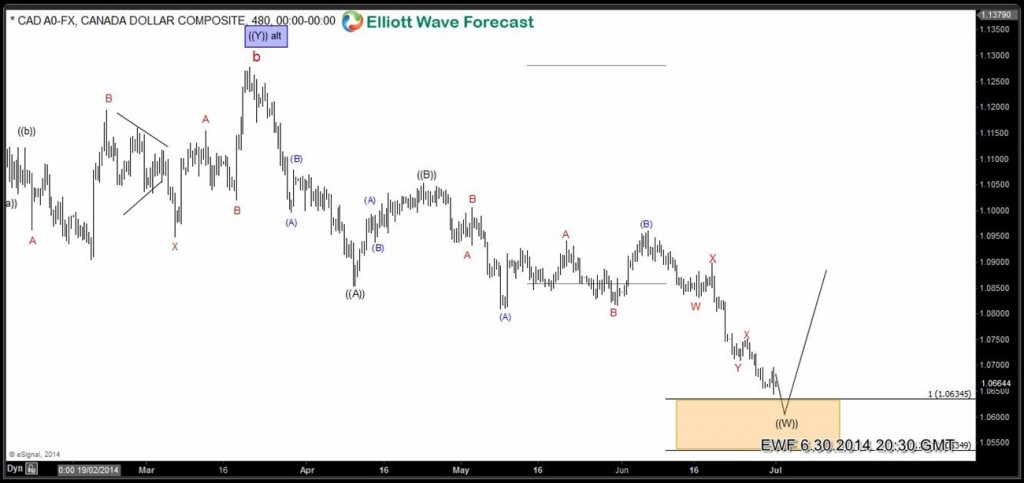
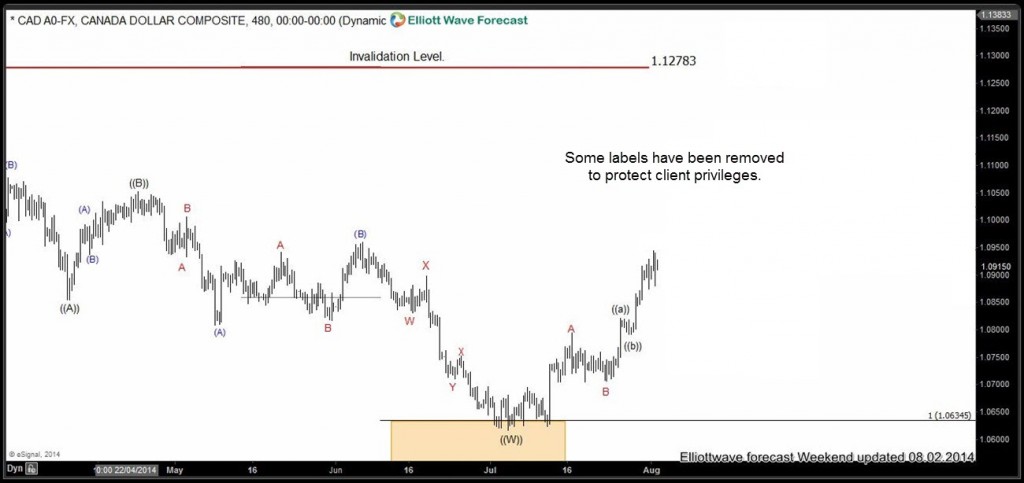
From the last week of the June we were telling our clients to take the profits from the short positions in USDCAD and to start looking for buy entries because preferred Elliott wave structure was suggesting price was approaching the inflection area between 1.06345-1.05349 .Let’s take a look at some charts from members area to see how the move unfolded
This is H4 chart from the June 30/2014 . We were calling for end of ((w)) cycle and rally from there…
This is how the chart looks today H4 chart August 02/2014 . We can see the price has turned higher as expected and made 300 pips rally, so far.
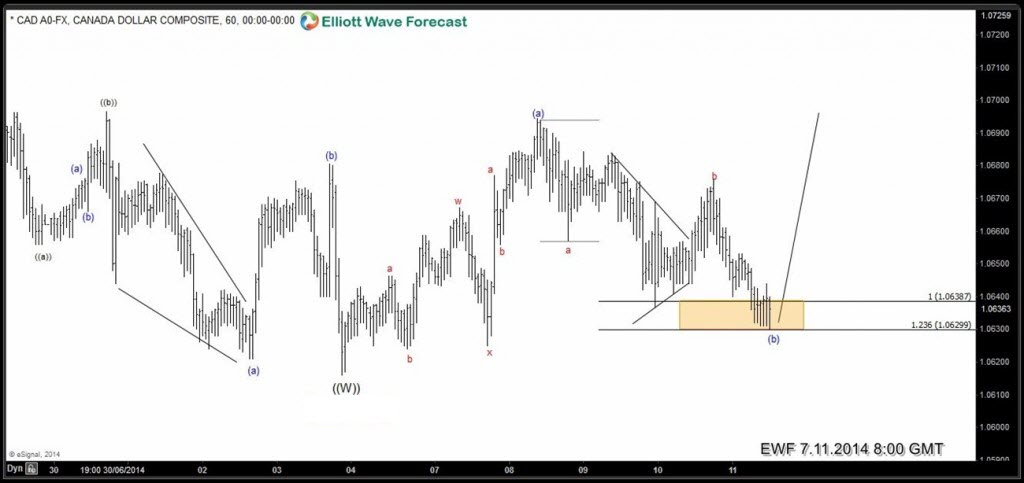
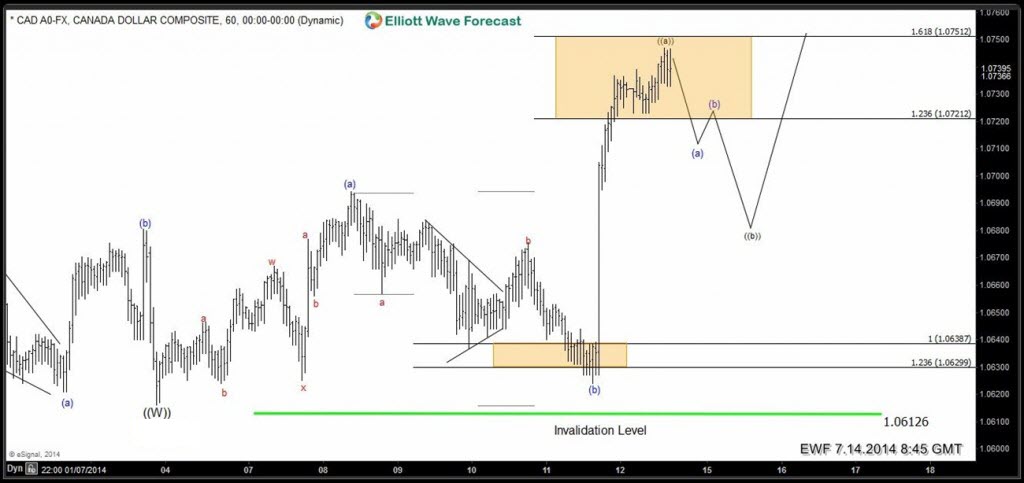
Now, let’s take a look at the H1 charts from the July, to see how we were guiding our members through this pair.
H1 Chart July 11/2014 (London Update) The price had entered important technical area, we were expecting end of corrective wave (b) and rally from there
H1 chart July 14/2014 (London Update) $USDCAD made strong rally from equal legs area as expected, the count was calling for pull back and contination of up trend
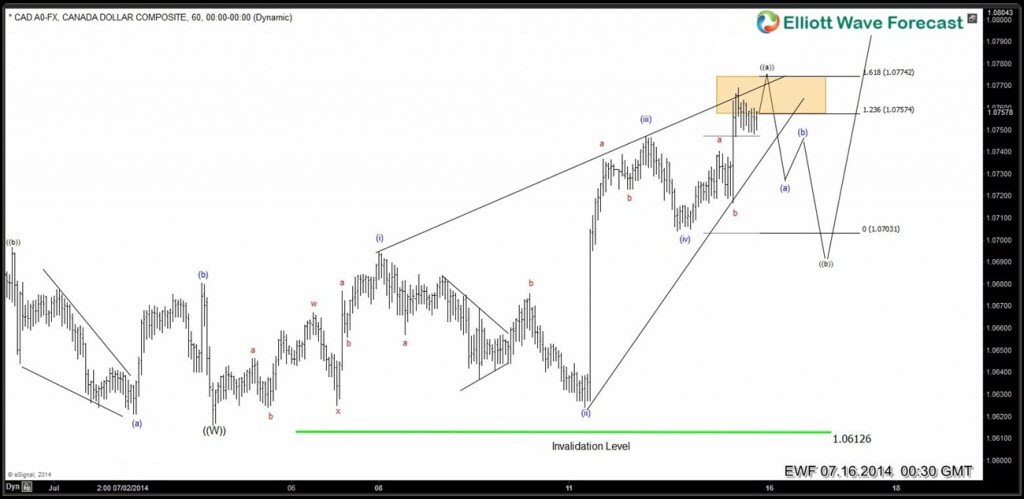
H1 chart July 16/2014 (Asia Update) We got shallow pull back and more strength. Count had been changed in umpulsive,which was calling for another marginal push higher & pull back – wave ((b))
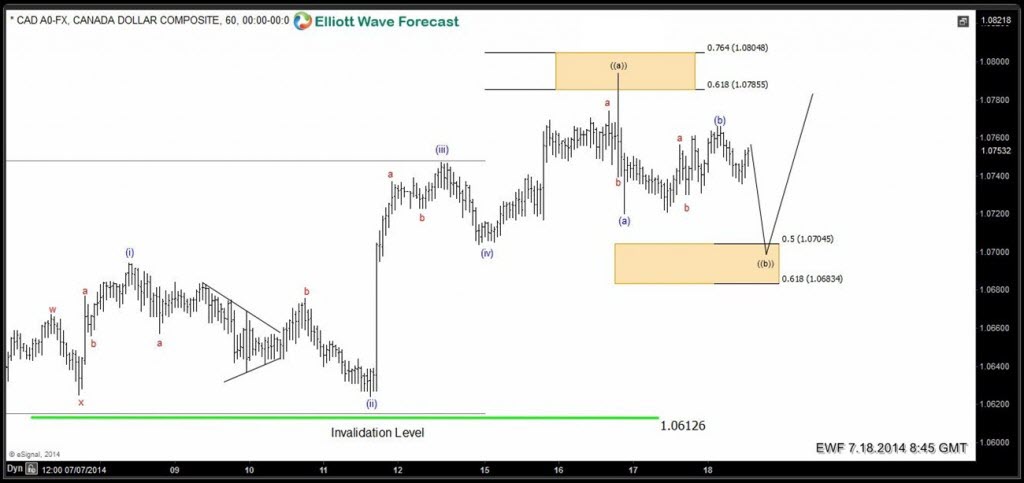
H1 Chart July 18/2014 the price gave us push higher and decline as expected.Pull back ((b)) was in progress … we were looking for another push lower toward 50-61.8 fibonacci area (1.0745-1.06834)
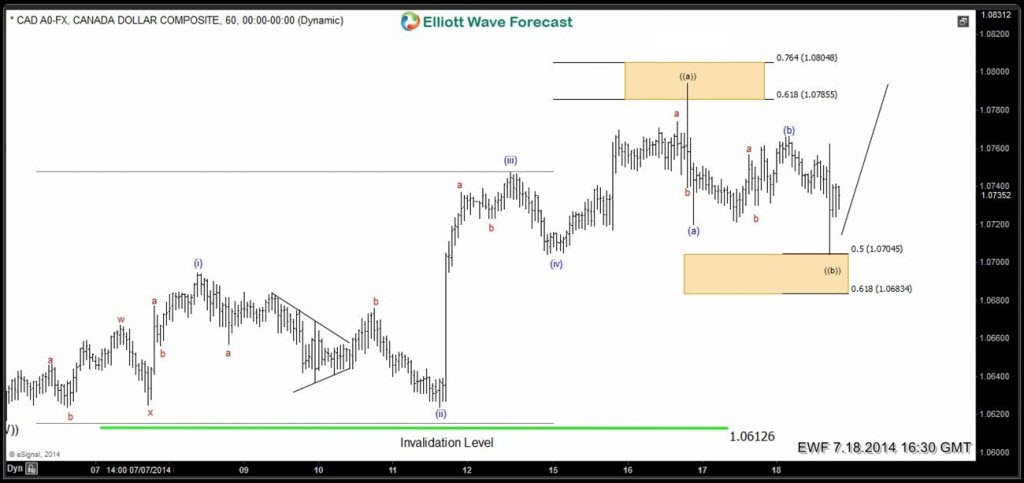
H1 chart July 18/2014 (Mid-day Update ) The price bounced right at 50 fib…
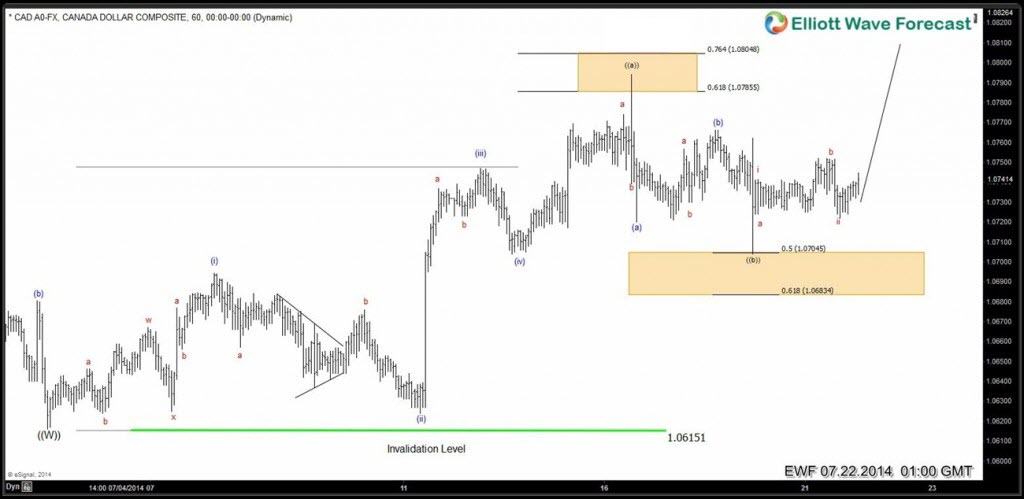
H1 chart July 22/2014 (Asia Update) the price had been doing sideway, more strength was expected…
H1 chart July 25/2014 (Mid-day Update) the price had been in sideway consolidation for few more days and finaly we got push higher toward 1.08161 area … we were looking for more strength…
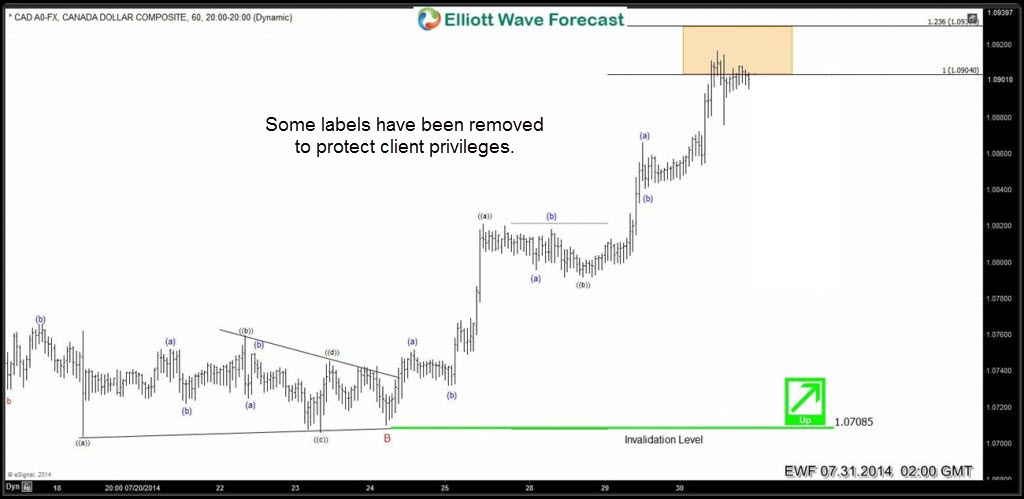
H1 chart July 31/2014 (Asia Update) the price has given us more strength as expected…
If you would like to have access of EWF analysis in real time and master Elliott Wave like a Pro ,we invite you to join Elliott Wave Forecast and learn from our Market Experts. You can choose the plan here or you can take Free Trial and get acces of Premium Plus Plan 2 weeks for Free. We provide Elliott Wave charts in 4 different time frames, 2 live webinars by our expert analysts every day, 24 hour chat room, market overview,daily and weekly technical videos and much more. Also, as our member you have an opportunity to purchase great Instructional EWF videos at very affordable prices.
Back
