Elliott Wave Forecast

Login
Start 14-Day Trial
  • Plans and Pricing
    2 for 1 + Upto $120 Off
  • Education
    Upto 70% off
    • 6 Educational Seminar Recordings – 50% Off
    • 4 Educational Seminar Recordings – 50% Off
    • EW Structures & Swing Sequence – 70% Off
    • Platinum Package – 25% Off
    • Trading Execution Seminar – 55% Off
    • New Elliott Wave, Correlation & Trading Execution – 55% Off
    • Premium Plus Package – 25% Off
    • Learn Elliott Wave – 55% Off
    • 1-1 Training – Save $75
    • Premium Package – 25% Off
    • Trading Right Side using Elliott Wave Theory, Cycles and Sequences – 55% Off
    • Elliottwave, Market Dynamic and Correlations – 55% Off
  • Resources
    • Elliott Wave Theory
    • E-Books
      • Elliott Wave eBook
      • eBook – Comprehensive Guide to Trading Stocks & ETFs
      • eBook – Complete Beginners Guide to Forex Trading
      • eBook – Best Trading Strategies Using Elliott Wave Theory
    • Position Size Calculator
    • Risk/Reward Calculator
    • News
    • Newsletter
    • Crypto-Currencies
  • Free Articles
  • About Us
  • Performance

NZDJPY Making Strong Comeback From Blue Box

CalendarMonday 6 November 2023 User By Hassan Sheikh

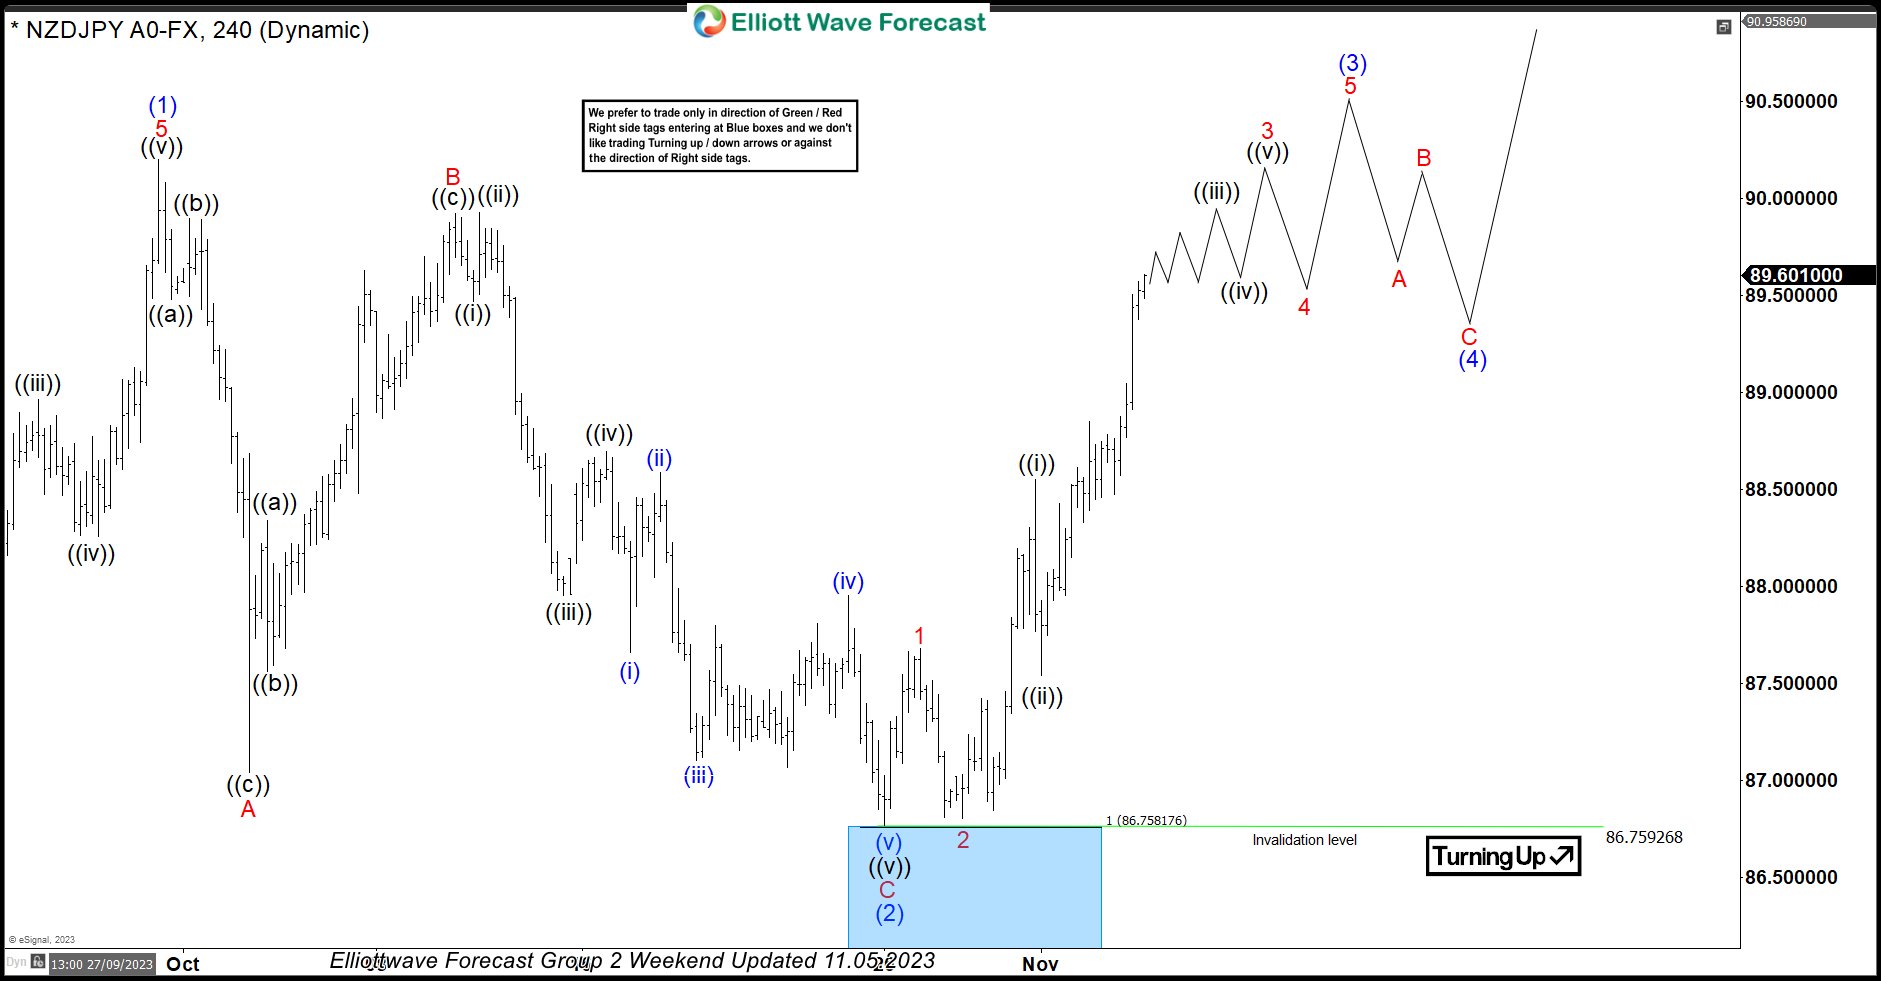
In this technical blog, we will look at the past performance of the 4-hour Elliott Wave Charts of NZDJPY. In which, the rally from 24 March 2023 low unfolded as an impulse sequence and showed a higher high sequence. Therefore, we knew that the structure in NZDJPY is incomplete to the upside & should extend higher. So, […]

READ MORE +

  • $USDCAD possible FLAT in 5 minute chart

    $USDCAD possible FLAT in 5 minute chart


    USDCAD 5 min chart is showing a possible FLAT structure which is a 3-3-5 structure. We have 3 waves up from 1.1037 – 1.1082 and 3 waves down to 1.1033. After that we can count 5 waves up to 1.1110 level with divergence in RSI. As far as RSI divergence remains intact and price stays […]

    Read More
  • USDINR Monthly outlook.3.2.2014

    USDINR Monthly outlook.3.2.2014


    Let’s take a look at Elliott Wave Analysis on the monthly chart of USDINR pair.       Try elliottwave-forecast.com only $9.99 for 14 days Click here . ElliottWave-Forecast has built our reputation on accurate technical analysis and a winning attitude. By successfully incorporating the Elliott Wave Theory we provide precise forecasts with up-to-date analysis for […]

    Read More
  • $EURJPY finds buyers on the dip

    $EURJPY finds buyers on the dip


    EURJPY dropped hard on 2.27.2014 but members knew it was a great buying opportunity. Let’s take a look at some charts from members area before the drop, what was expected afterward and what actually happenend

    Read More
  • $EURUSD navigating the swings

    $EURUSD navigating the swings


    EURUSD spent a lot of time consolidating between 1.3773 – 1.3683 range before finally breaking lower and rallying to new highs. Let’s take a look at some charts from members area to see how it all unfolded

    Read More
  • $EURGBP breaks 0.8163 as expected


    EURGBP video showing Elliott wave analysis of the pair and calling for new lows below 0.8163 after the pivot at that level gave up in the proprietary system that we use.   Market is dynamic, so why not Sign up for 14 day Trial of the service by clicking on linking on the right to […]

    Read More
  • $USDCAD working on a 7 swing structure

    $USDCAD working on a 7 swing structure


    Let’s take a look at USDCAD price action from 1.1225 (1.31.2014). Drop from 1.1225 – 1.0968 was a corrective decline and has been sub-divided in 3 larger 3 swings labelled (( a )) – (( b )) and A. Pair attempted to rally and failed almost at 50% fib retracement of the drop from 1.1225 […]

    Read More
  • ‹ Newer 1 … 222 223 224 225 226 227 228 229 230 231 232 233 234 235 236 237 238 239 240 … 257 Older ›
Elliott Wave Forecast
Categories
  • Video Blog
  • Trading
  • Stock Market
  • News
  • Forex
  • Elliottwave
  • Cryptos
  • Commodities
  • Bond
  • Blue Box Wins
  • Aidans Corner
Latest Post
  • QQQ Short Term Cycle Nearing End; Pullback Likely to Attract Buyers
  • Silver (XAGUSD) Ongoing Impulsive Rally Points Toward Higher Extension
  • TXN Rebounds Strongly from Blue Box, Wave (3) Targets $285
  • Russell 2000 (IWM) Enters Correction Phase Following Impulsive Advance
  • Sprott Physical Silver Trust (PSLV) Surges to a New All‑Time High
Leading Elliott Wave technical analysis firm covering all major asset groups.

Forex

  • EUR/USD Forecast
  • GBP/USD Forecast
  • EUR/GBP Forecast
  • AUD/USD Forecast
  • GBP/JPY Forecast
  • EUR/JPY Forecast
  • USD/CHF Forecast

Stock Market

  • NASDAQ Forecast
  • DOW JONES Forecast
  • FTSE INDEX Forecast
  • DAX INDEX Forecast
  • NIFTY 50 Forecast
  • IBEX INDEX Forecast
  • S&P500 (SPX) Forecast

Commodities

  • Silver Forecast
  • Gold Forecast
  • Palladium Forecast
  • Copper Forecast
  • OIL Forecast
  • Natural Gas Forecast

Resources

  • Crypto-Currencies
  • Elliott Wave Videos
  • FAQs
  • Forex Signals
  • Commodity Signals
  • Elliott Wave Theory
  • Free Articles
  • Position Size Calculator
  • News

Education

  • Free eBook
  • Educational Products
  • About Us
  • Best Trading Strategies

Subscriptions

  • Silver Plan
  • Gold Plan
  • Platinum Plan
  • Diamond Plan

Quick Links

  • Contact Us
  • Terms & Conditions
  • Privacy Policy
  • Disclaimer
  • FAQs
  • Jobs Opportunities
  • Testimonials
  • Cancellation / Refund Policy
  • Consent Preferences

Get in Touch

Contact Us

EME Processing & Consulting LLC. 7090 NW 173 Dr. Miami FL, 33015, USA

support@elliottwave-forecast.com

Copyright © 2025 All Rights Reserved

safe icon
Disclaimer: Futures, options, stocks, ETFs and over the counter foreign exchange products may involve substantial risk and may not be suitable for all investors. Leverage can work against you as well as for you. You should therefore carefully consider your investment experience as well as financial condition before deciding if trading is suitable for you.