
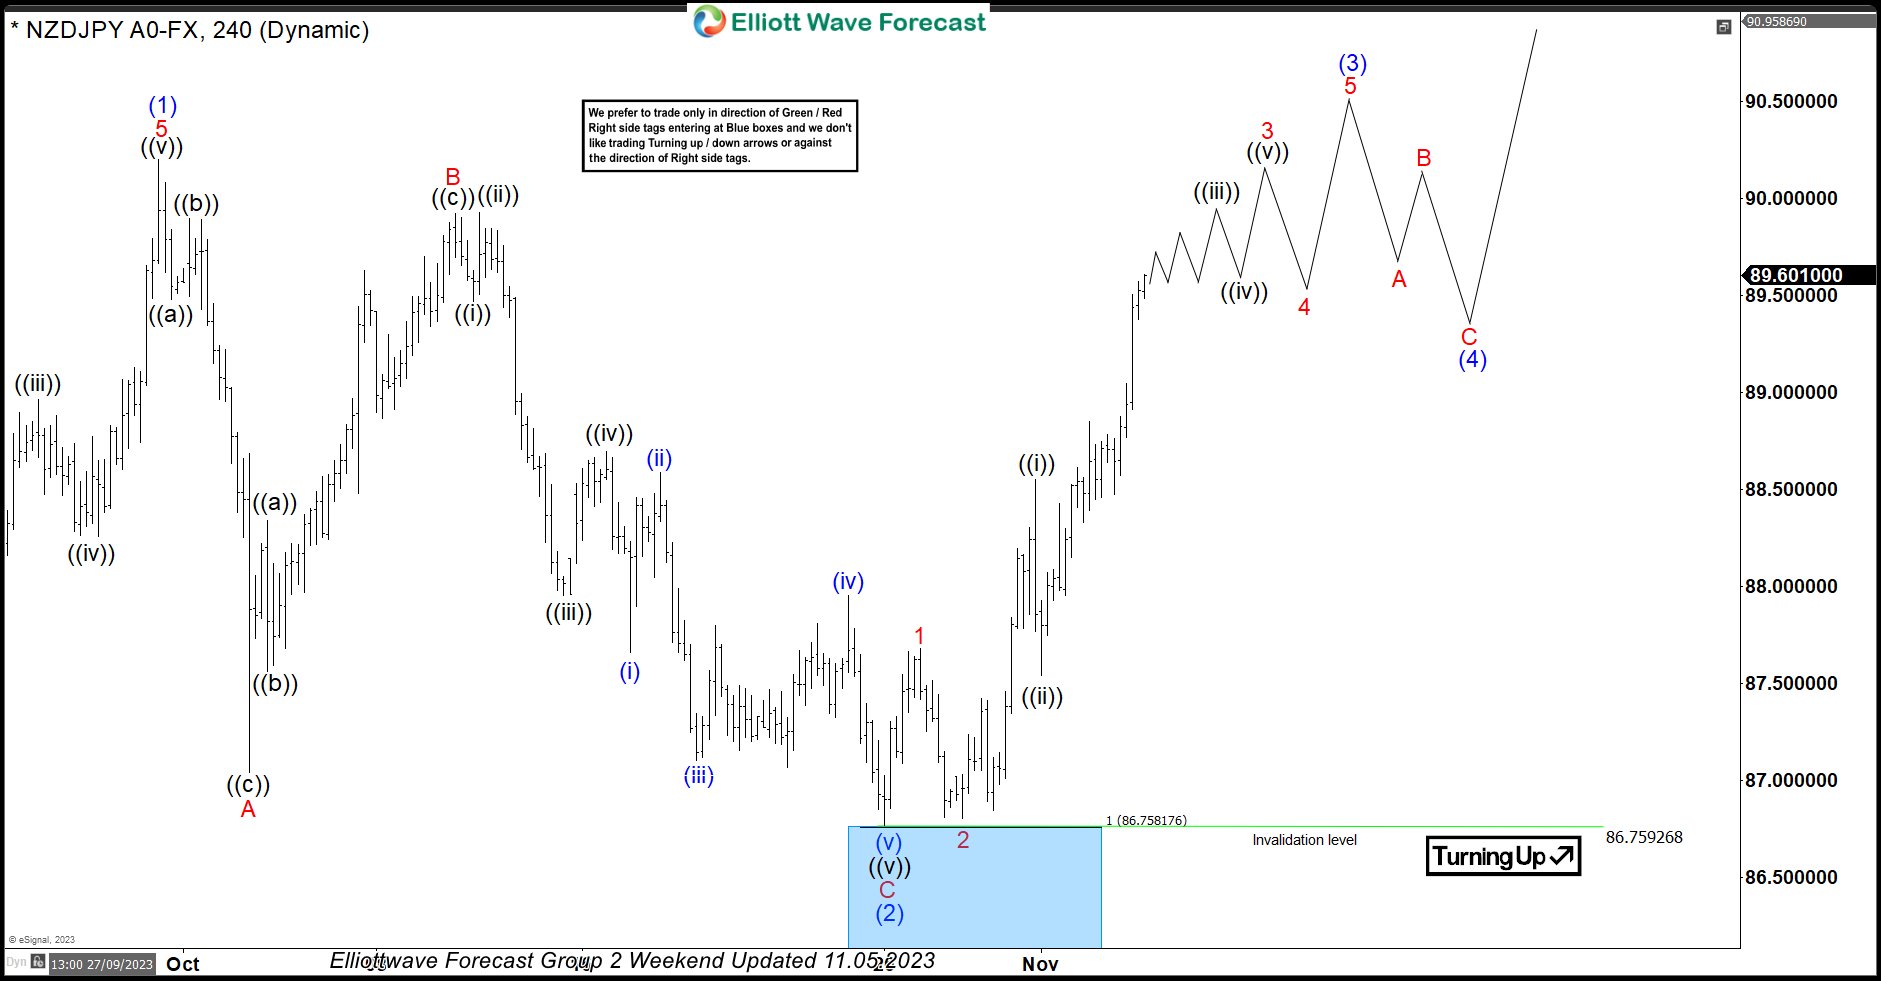
In this technical blog, we will look at the past performance of the 4-hour Elliott Wave Charts of NZDJPY. In which, the rally from 24 March 2023 low unfolded as an impulse sequence and showed a higher high sequence. Therefore, we knew that the structure in NZDJPY is incomplete to the upside & should extend higher. So, […]
-

USDJPY Elliott Wave Video
Read MorePreferred Elliott Wave view is the dips in the pair should hold above 115.82 low for continuation higher. We think wave “W” ended at 118.83 and dip to 117.14 completed wave “X”. Expect a test of 118.69 to complete wave (w) before we get a pull back in wave (x) and higher again. If 118.69 is […]
-

EURUSD – Pre ECB Technical Analysis and Trade Plan
Read MoreHere is a quick blog from our Live Trading Room host, Dan Hussey. Take a look at how to manage your risk by using inflection zones and Elliot Wave to your advantage. The Live Trading Room is held daily from 12:30 PM EST (5:30 PM BST), join Dan there for more insight into these proven methods of trading. EURUSD […]
-
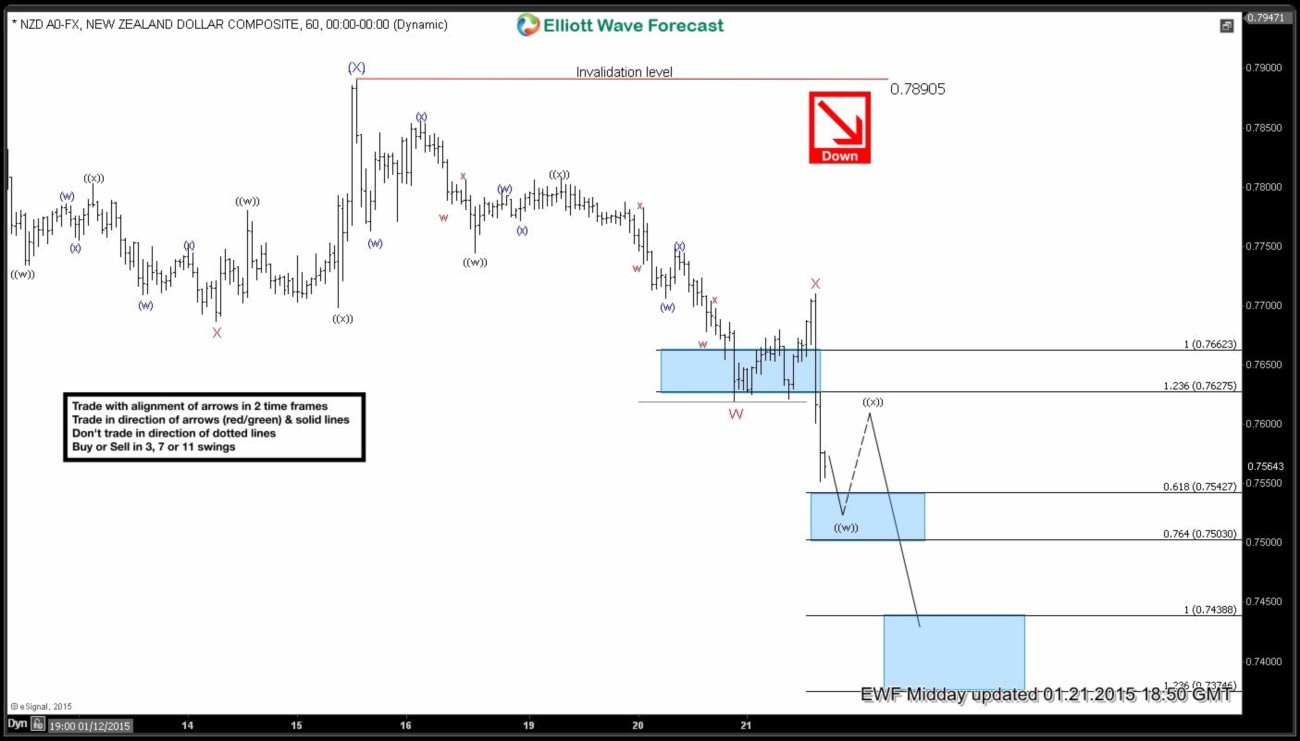
NZDUSD Short-term Elliott Wave Analysis 1.21.2015
Read MorePair remains bearish while below 0.7891 & now the X high at 0.7710. We expect wave (( w )) of Y to end in 0.7542 -0.7503 area followed by a bounce in wave (( x )) and then lower again toward 0.7438 – 0.7374 area to complete 7 swings down from 0.7891 high. After that there […]
-
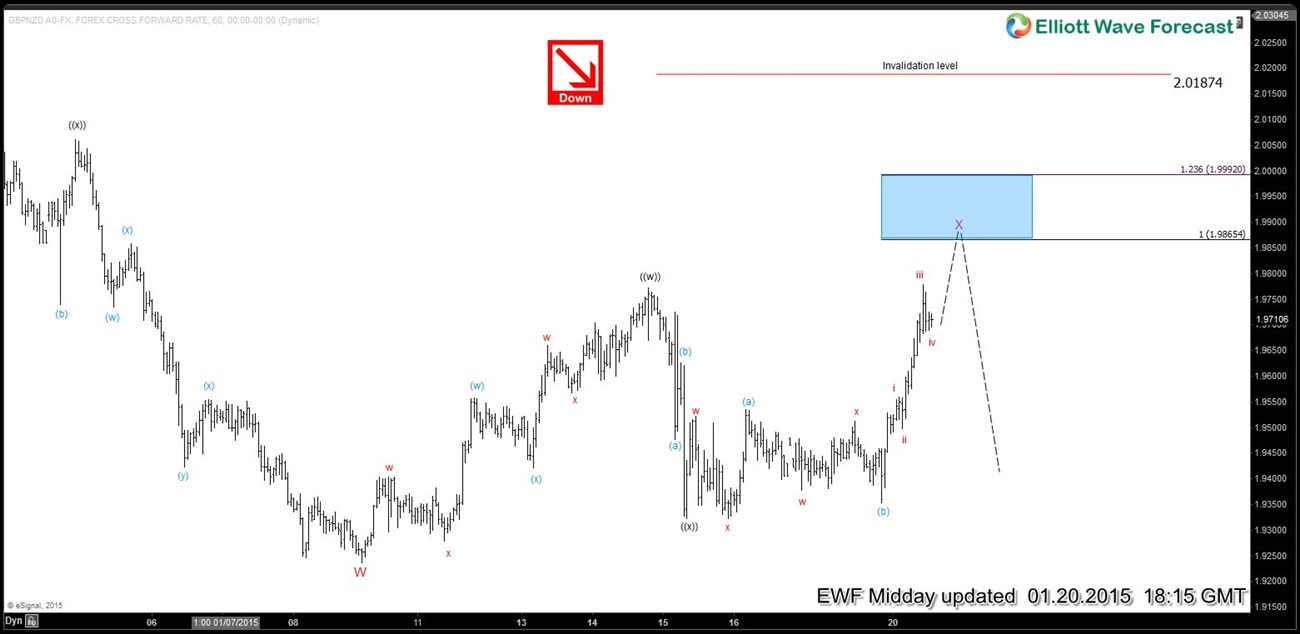
GBPNZD Short-term Elliott Wave Analysis 1.20.2015
Read MorePreferred Elliott Wave view suggests pair ended wave W at 1.9235, wave X bounce is in progress and taking the form of a (( w )) – (( x )) – (( y )) Elliottwave structure. Wave (( w )) ended at 1.9772, wave (( x )) at 1.9323 and wave (( y )) is […]
-
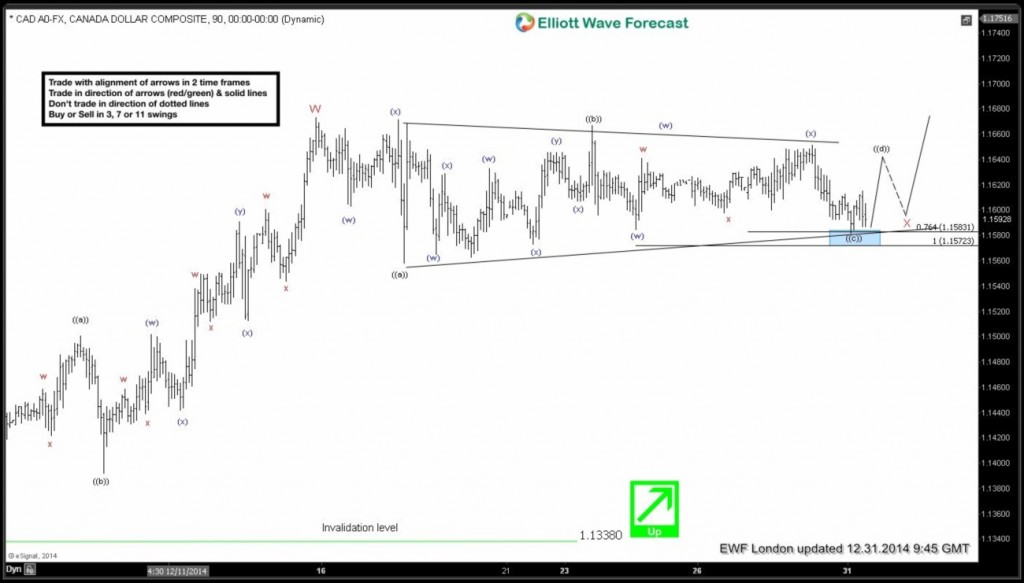
$USDCAD: Elliott Waves forecasting the rally & buying the dips
Read MoreAt the end of December 2014. USDCAD was doing bullish triangle in wave X connector. Wave ((c)) of triangle reached important technical area at 1.1583-1.1572 and rally was expected from there. We suggested our members to play long side in this pair against wave (( a )) of the triangle low at 1.5559. This was the […]
-
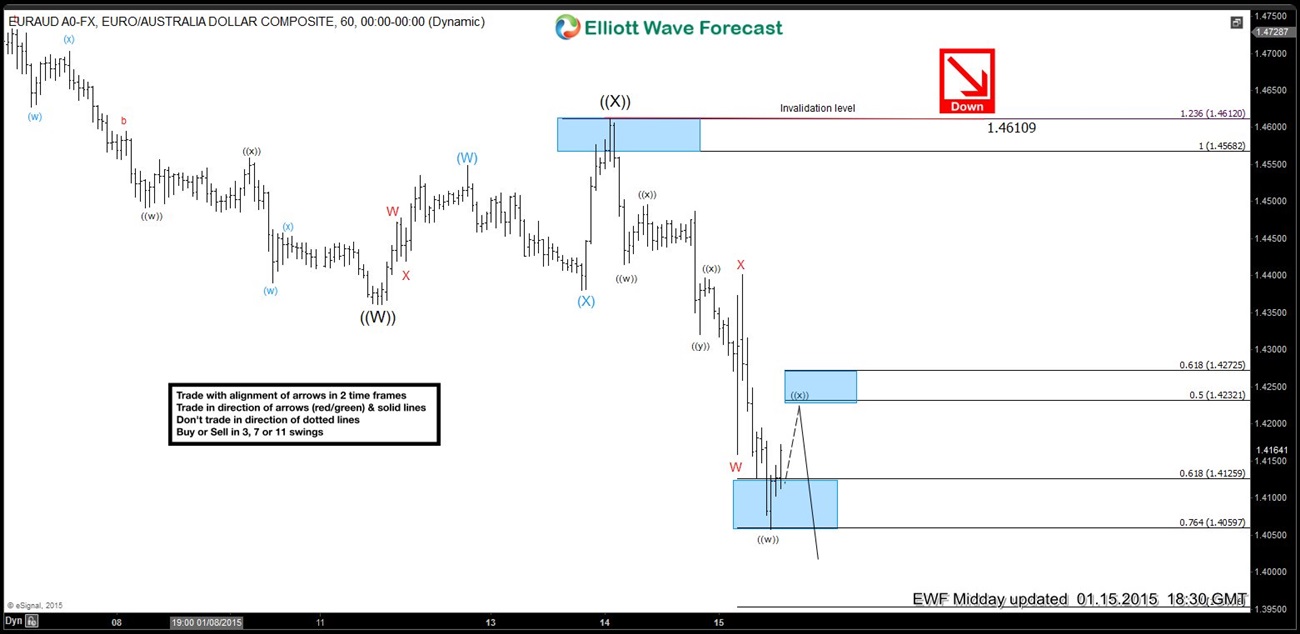
EURAUD Short-term Elliott Wave Analysis 1.15.2015
Read MoreWave (( X )) ended at 1.4610 and short-term wave X is also proposed to be over at 1.4402. Following a bounce in wave (( x )), expect another swing lower toward 1.3951 – 1.3845 area before next 3 wave bounce is seen. We don’t like buying the pair in proposed bounces and favour the short […]