
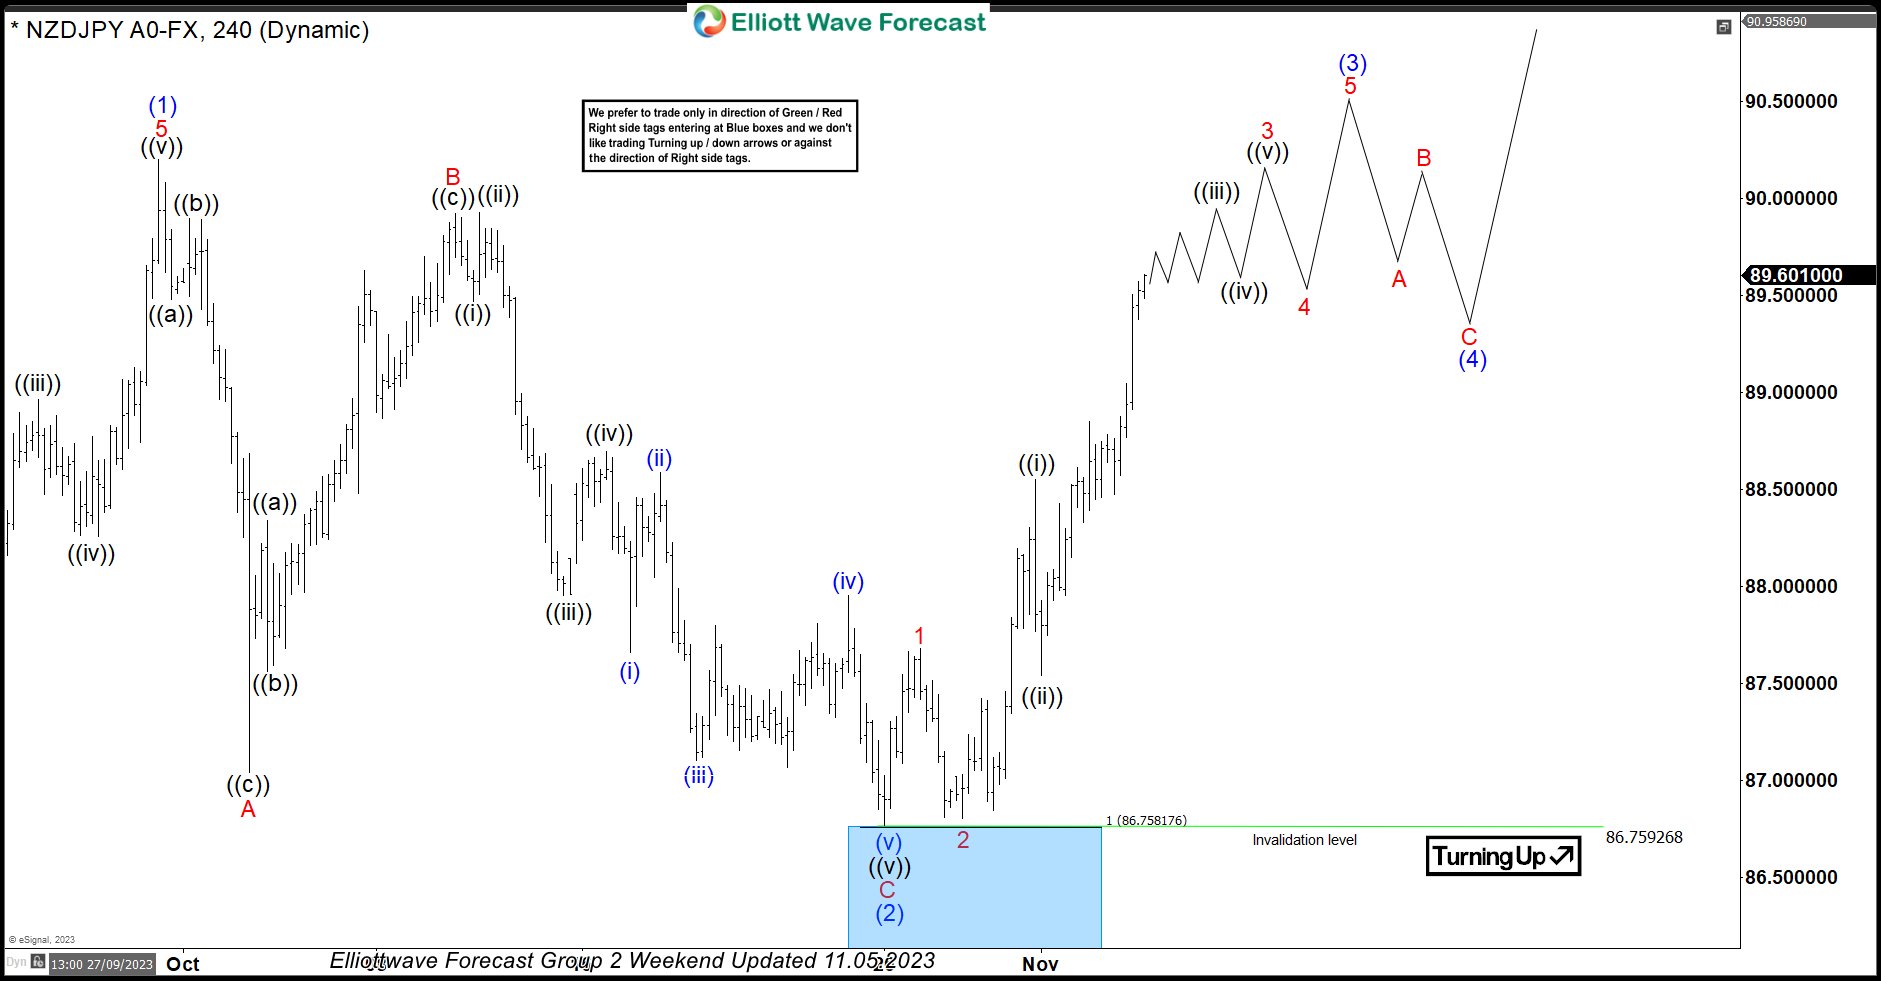
In this technical blog, we will look at the past performance of the 4-hour Elliott Wave Charts of NZDJPY. In which, the rally from 24 March 2023 low unfolded as an impulse sequence and showed a higher high sequence. Therefore, we knew that the structure in NZDJPY is incomplete to the upside & should extend higher. So, […]
-
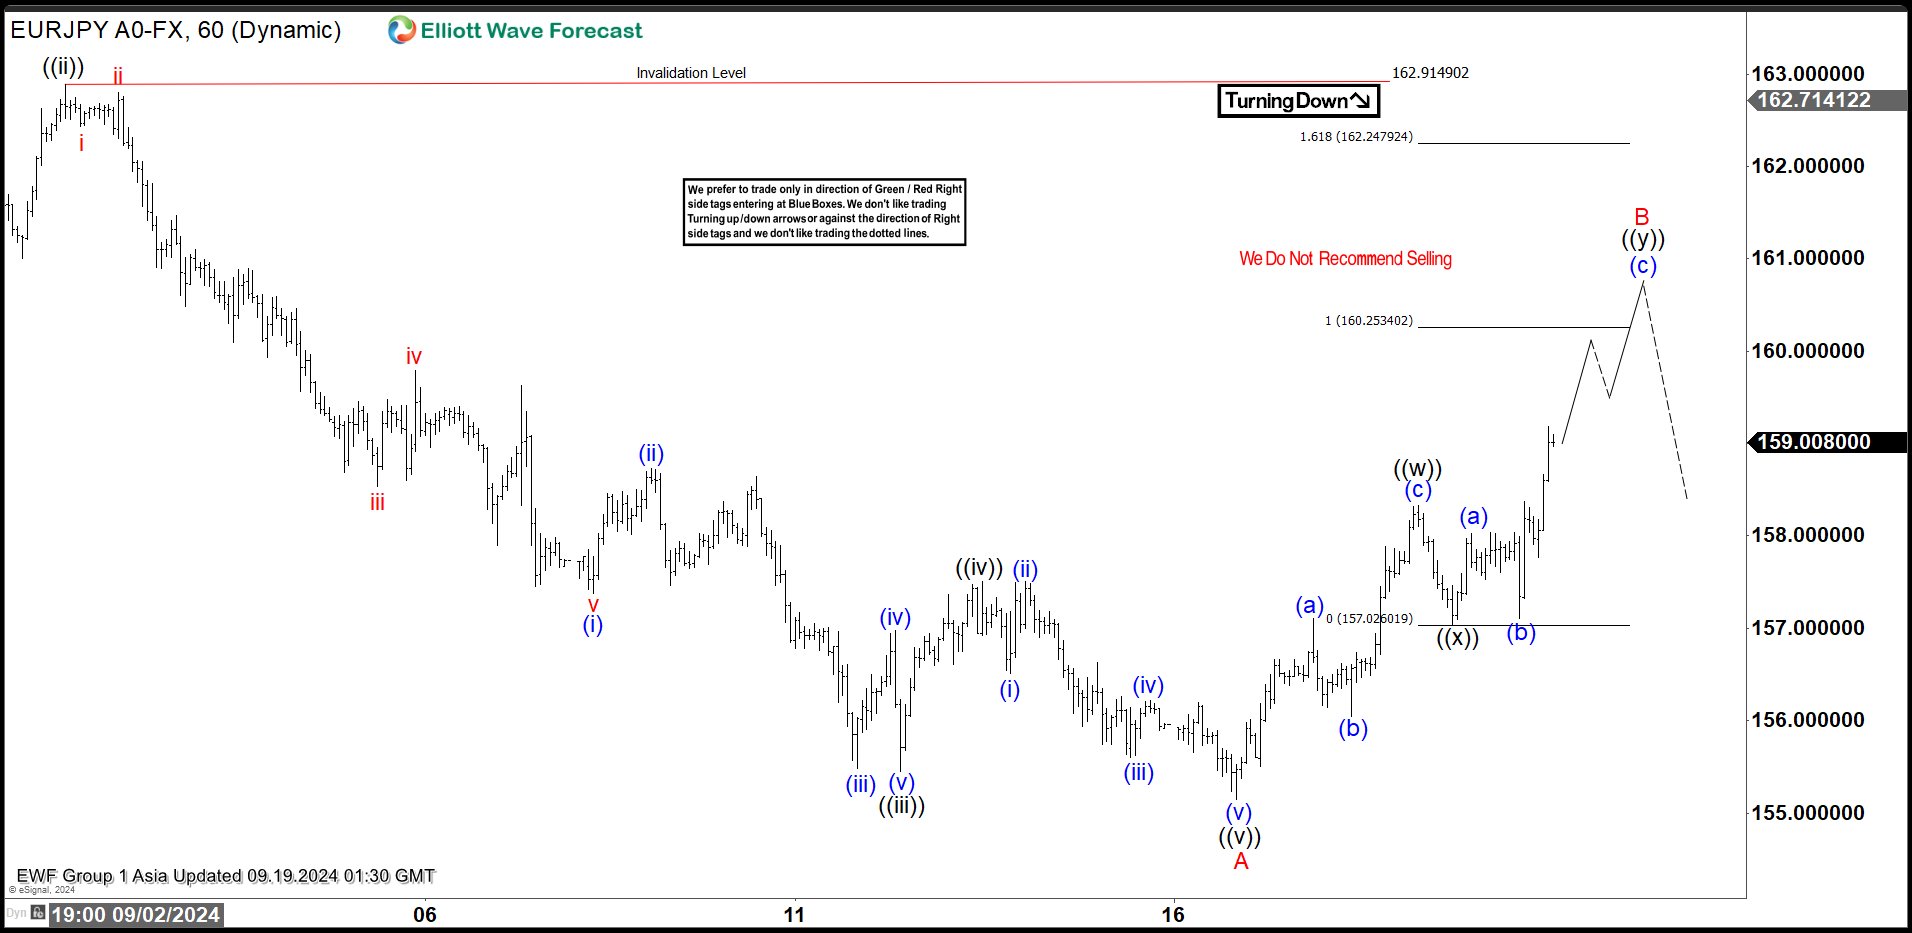
Elliott Wave View on EURJPY Expects Rally to Fail
Read MoreEURJPY rally to correct cycle from August 15 high and should fail in 3, 7, 11 swing for more downside. This article and video look at the Elliott Wave path.
-
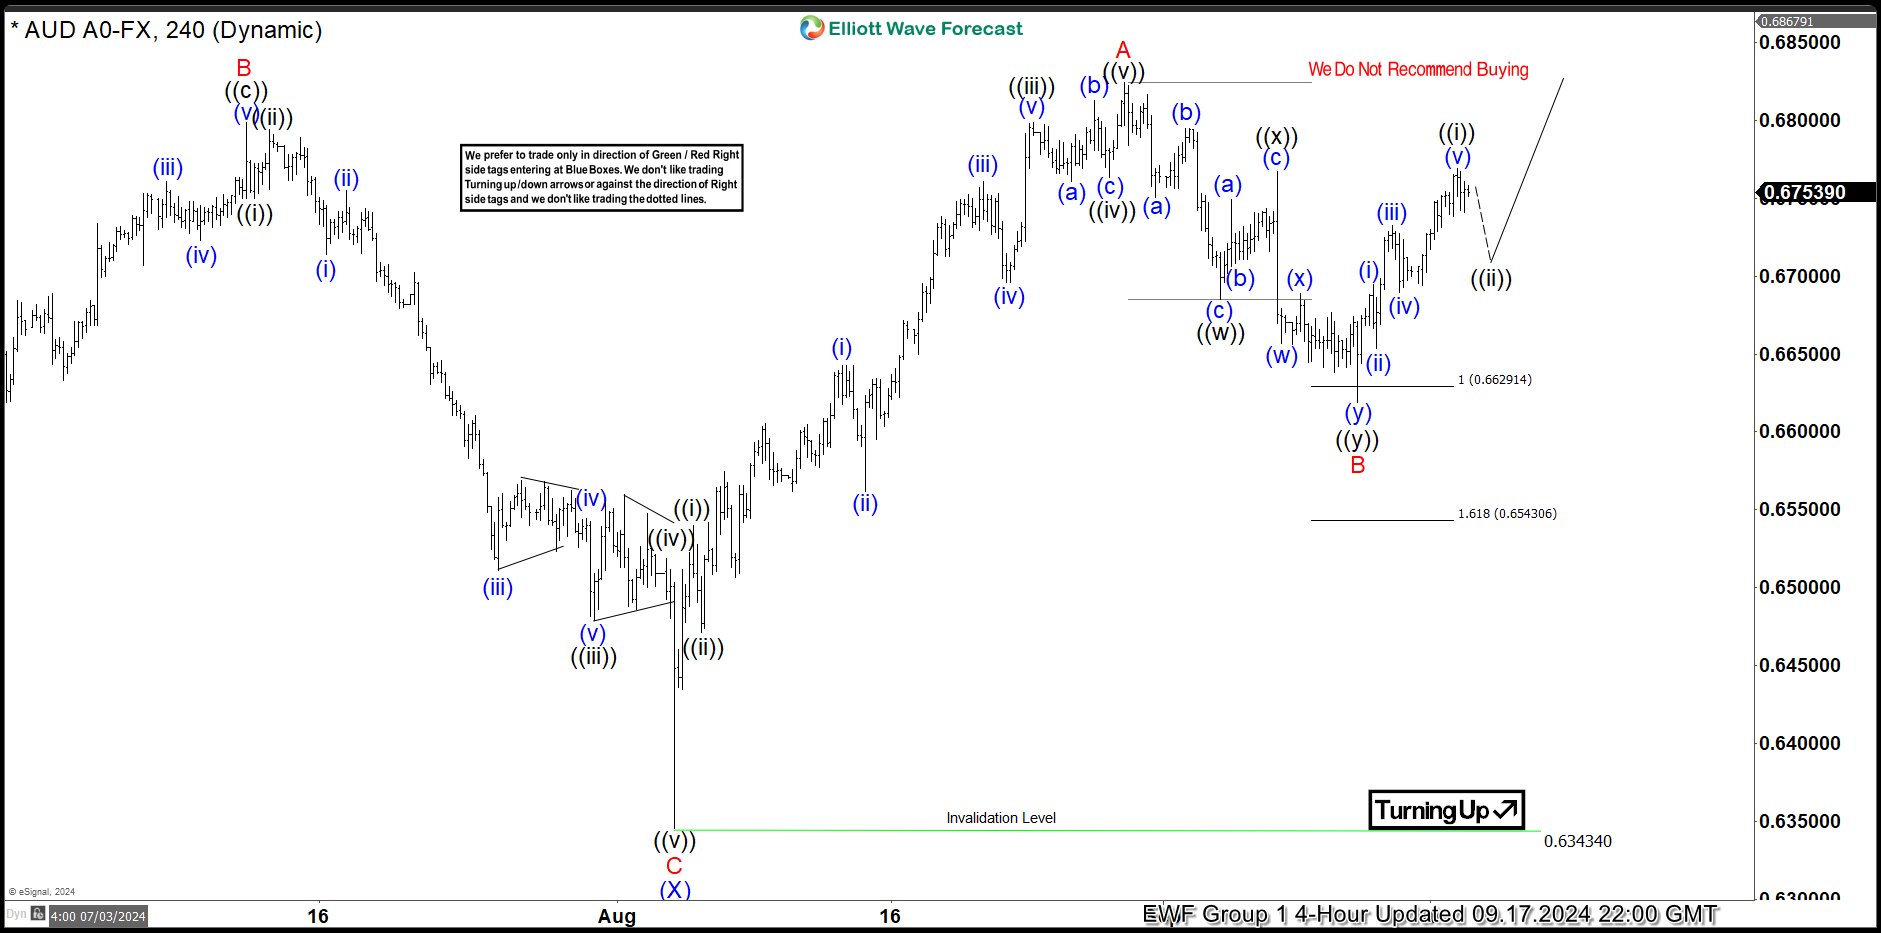
AUDUSD rallies from the extreme within a corrective structure
Read MoreHello traders. Welcome to another trading blog where we discuss chart setups that Elliottwave-Forecast members traded. In today’s blog, the spotlight will be on AUDUSD as the pair recently reacted as expected from an extreme area thus providing profitable trade ideas for members. Since the low of October 2022, AUDUSD has rallied and faltered multiple […]
-
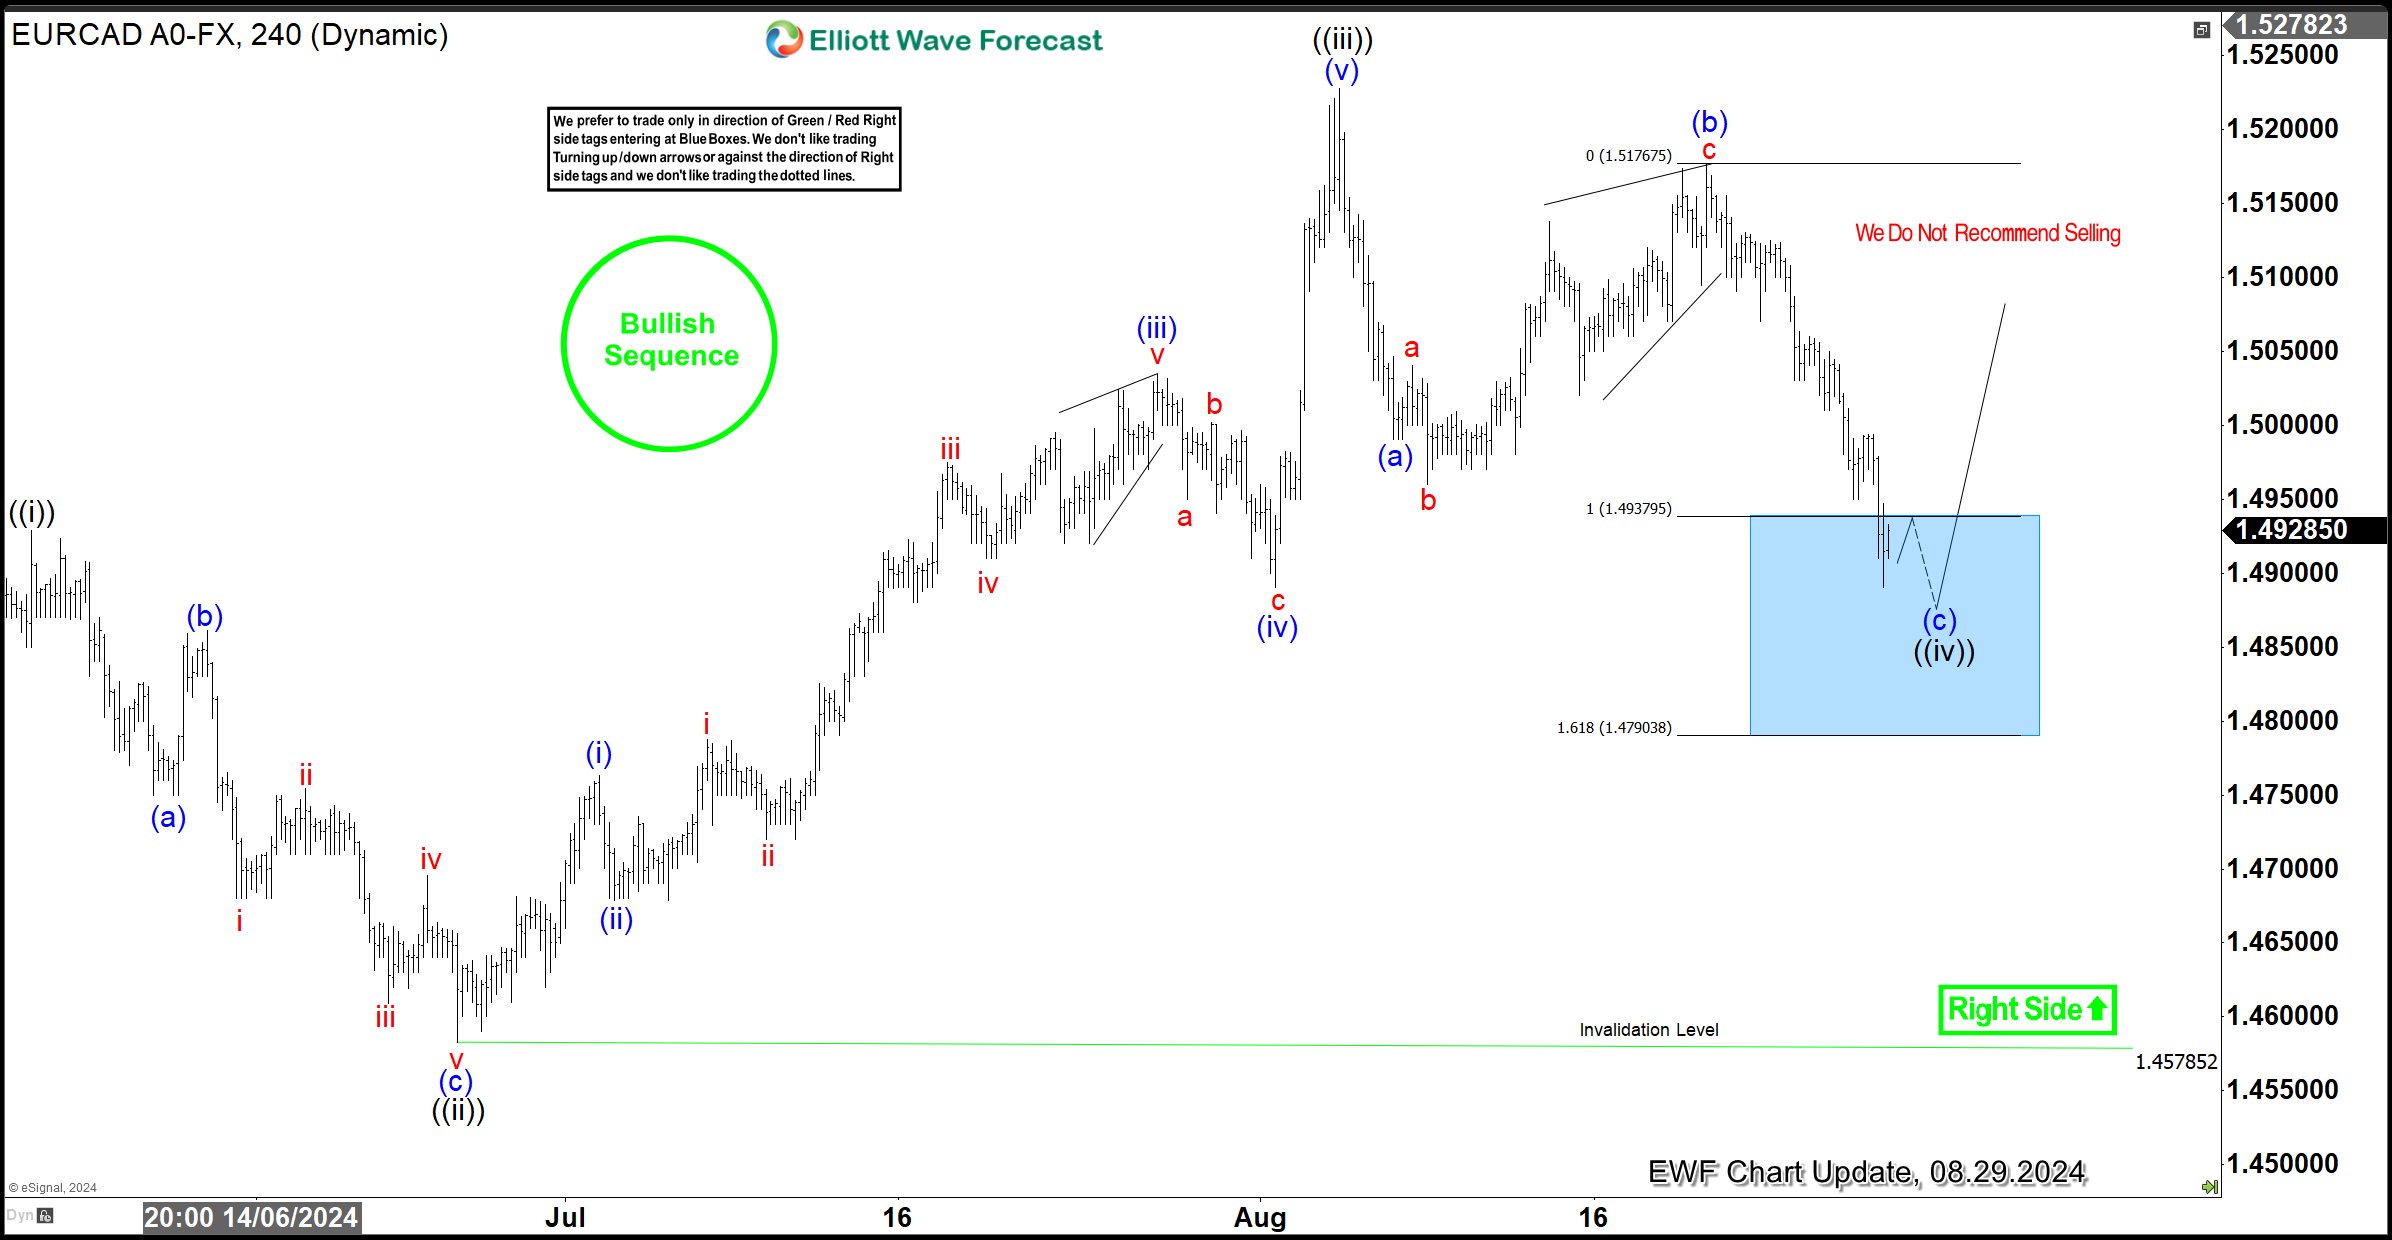
EURCAD Two-Year Bullish Sequence extends from the Blue Box
Read MoreHello traders, welcome to another trade review blog post where we discuss setups from the blue box. In this one, we will look at a recent setup on the EURCAD. We shared this setup with members of Elliottwave-Forecast. EURCAD has maintained a bullish sequence from the low in August 2022. From that low, the bullish […]
-
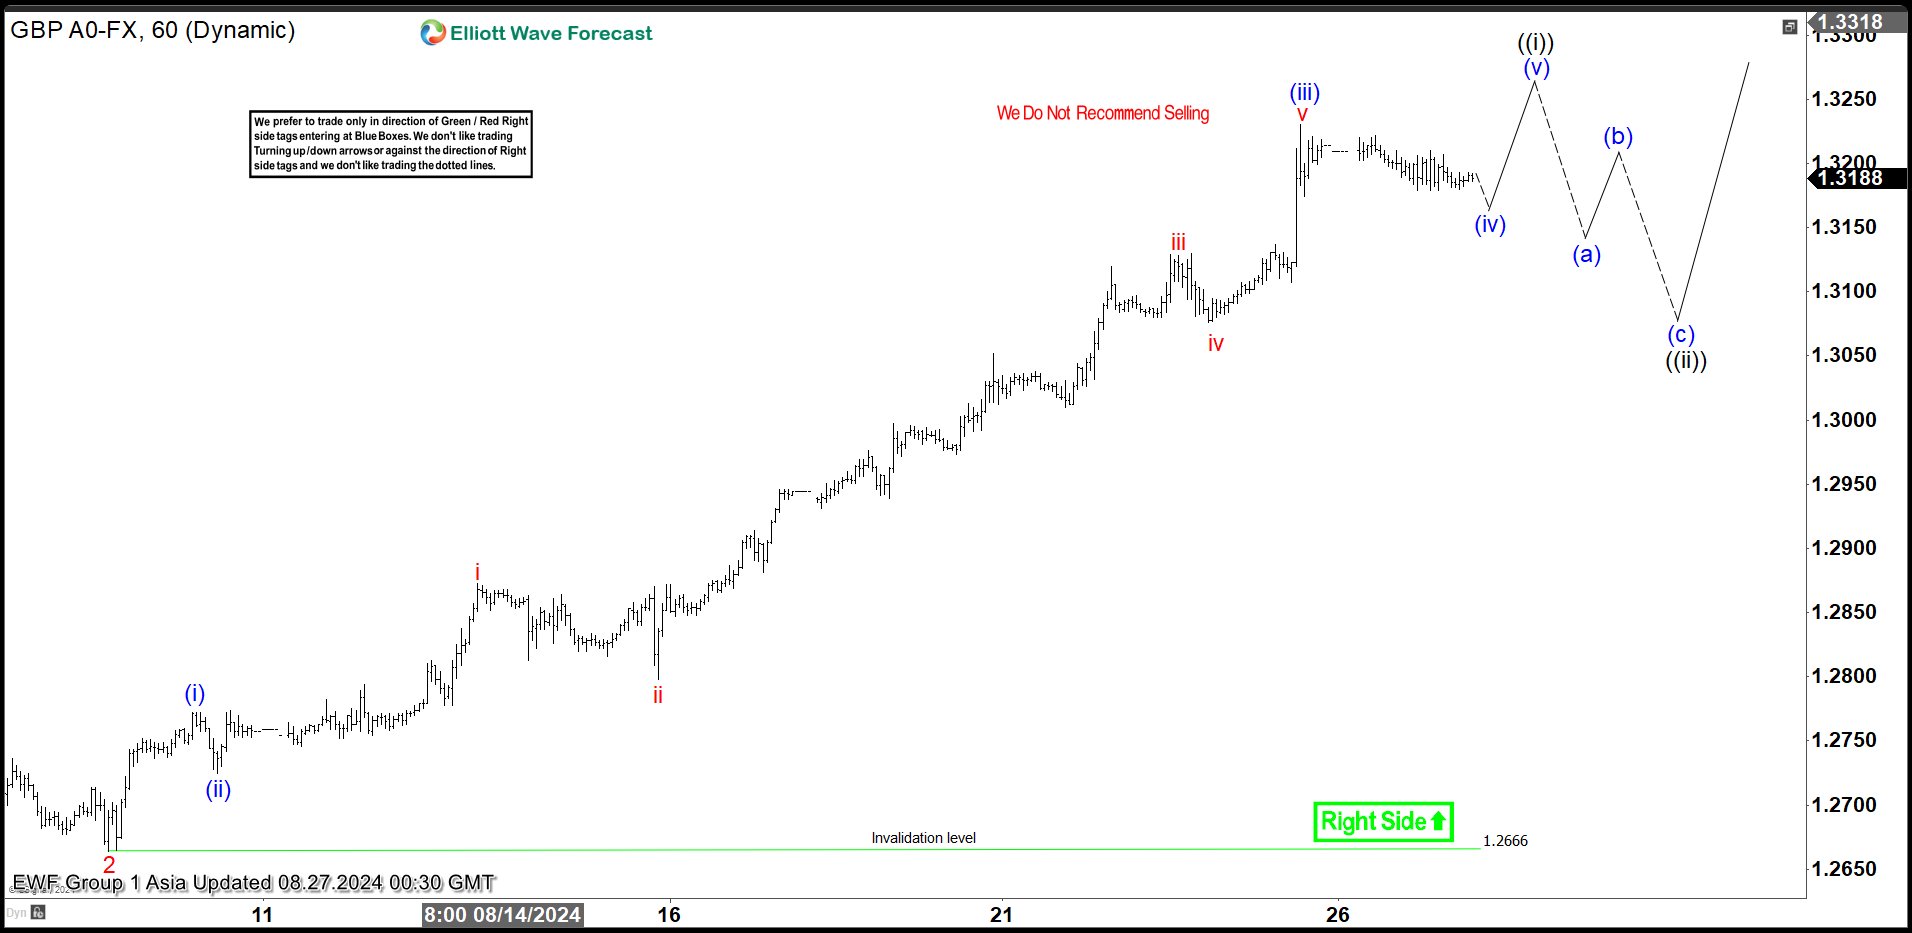
Elliott Wave Intraday Shows Bullish Sequence in GBPUSD
Read MoreGBPUSD shows a bullish sequence from September 2022 low favoring more upside. This article and video look at the Elliott Wave path.
-
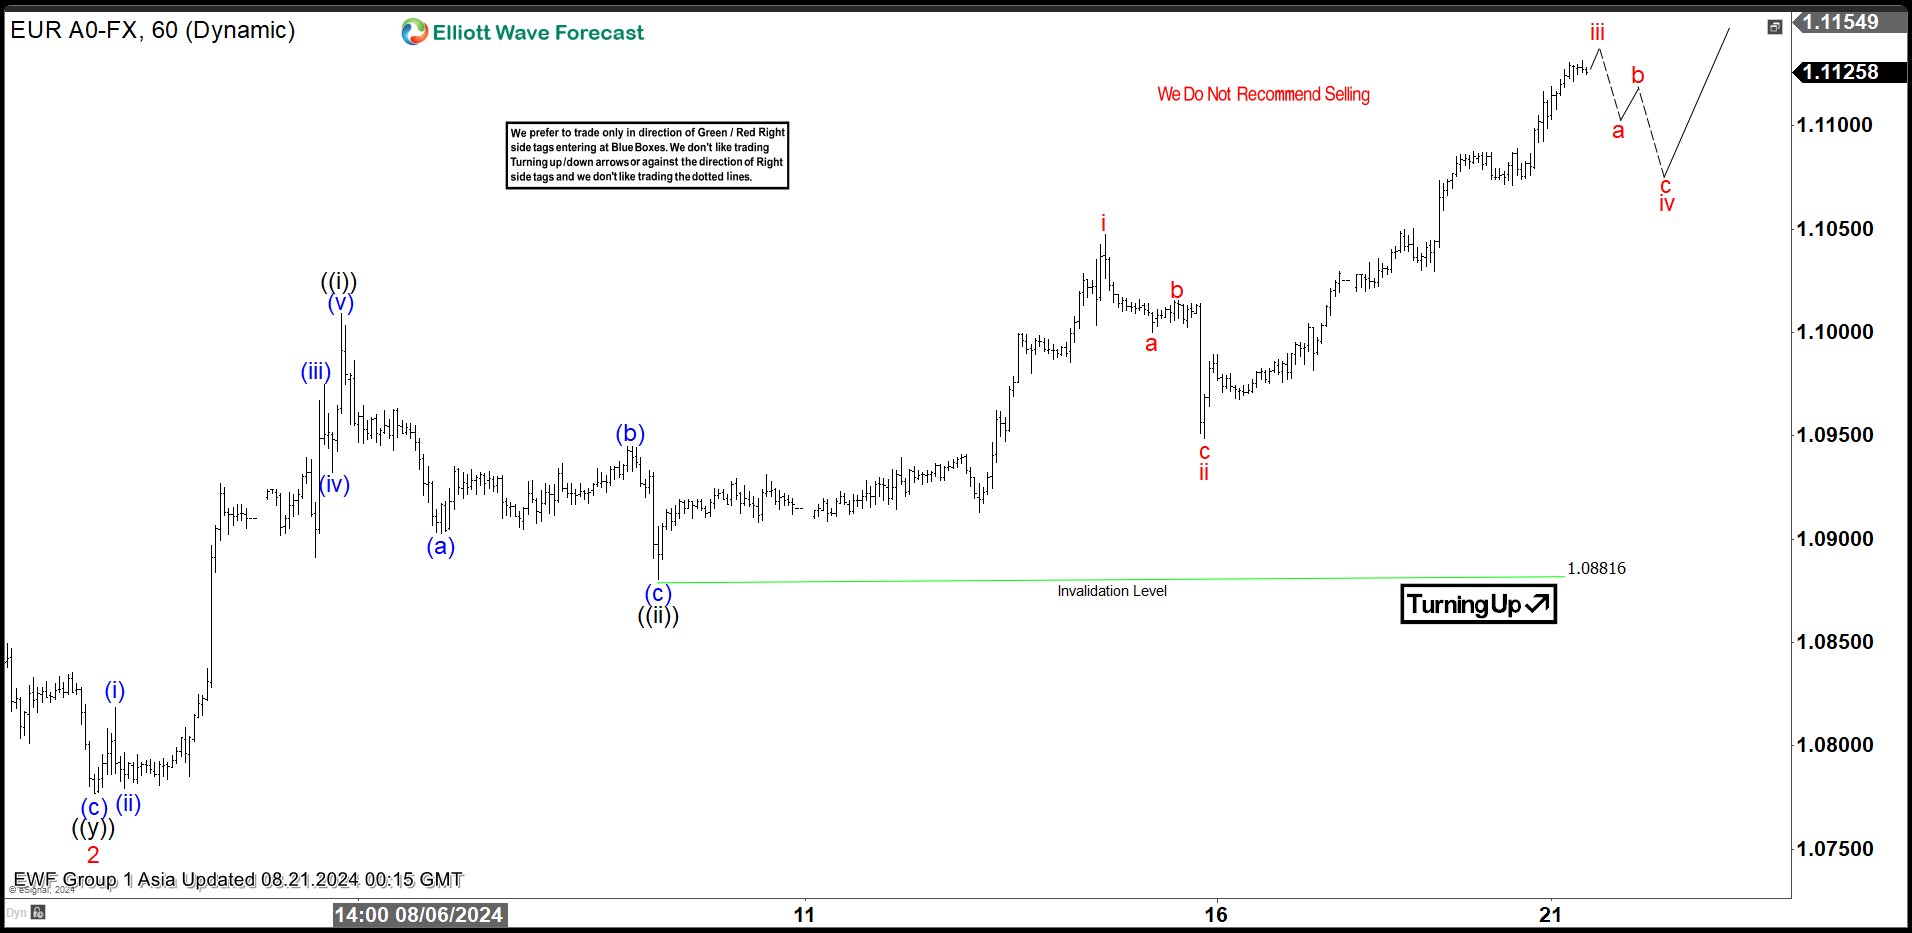
Elliott Wave Analysis on EURUSD Impulsive Rally Favors the Bull Side
Read MoreEURUSD is close to form a bullish sequence if it breaks above previous peak on 12.28.2023 high. This article & video look at the Elliott Wave path.
-
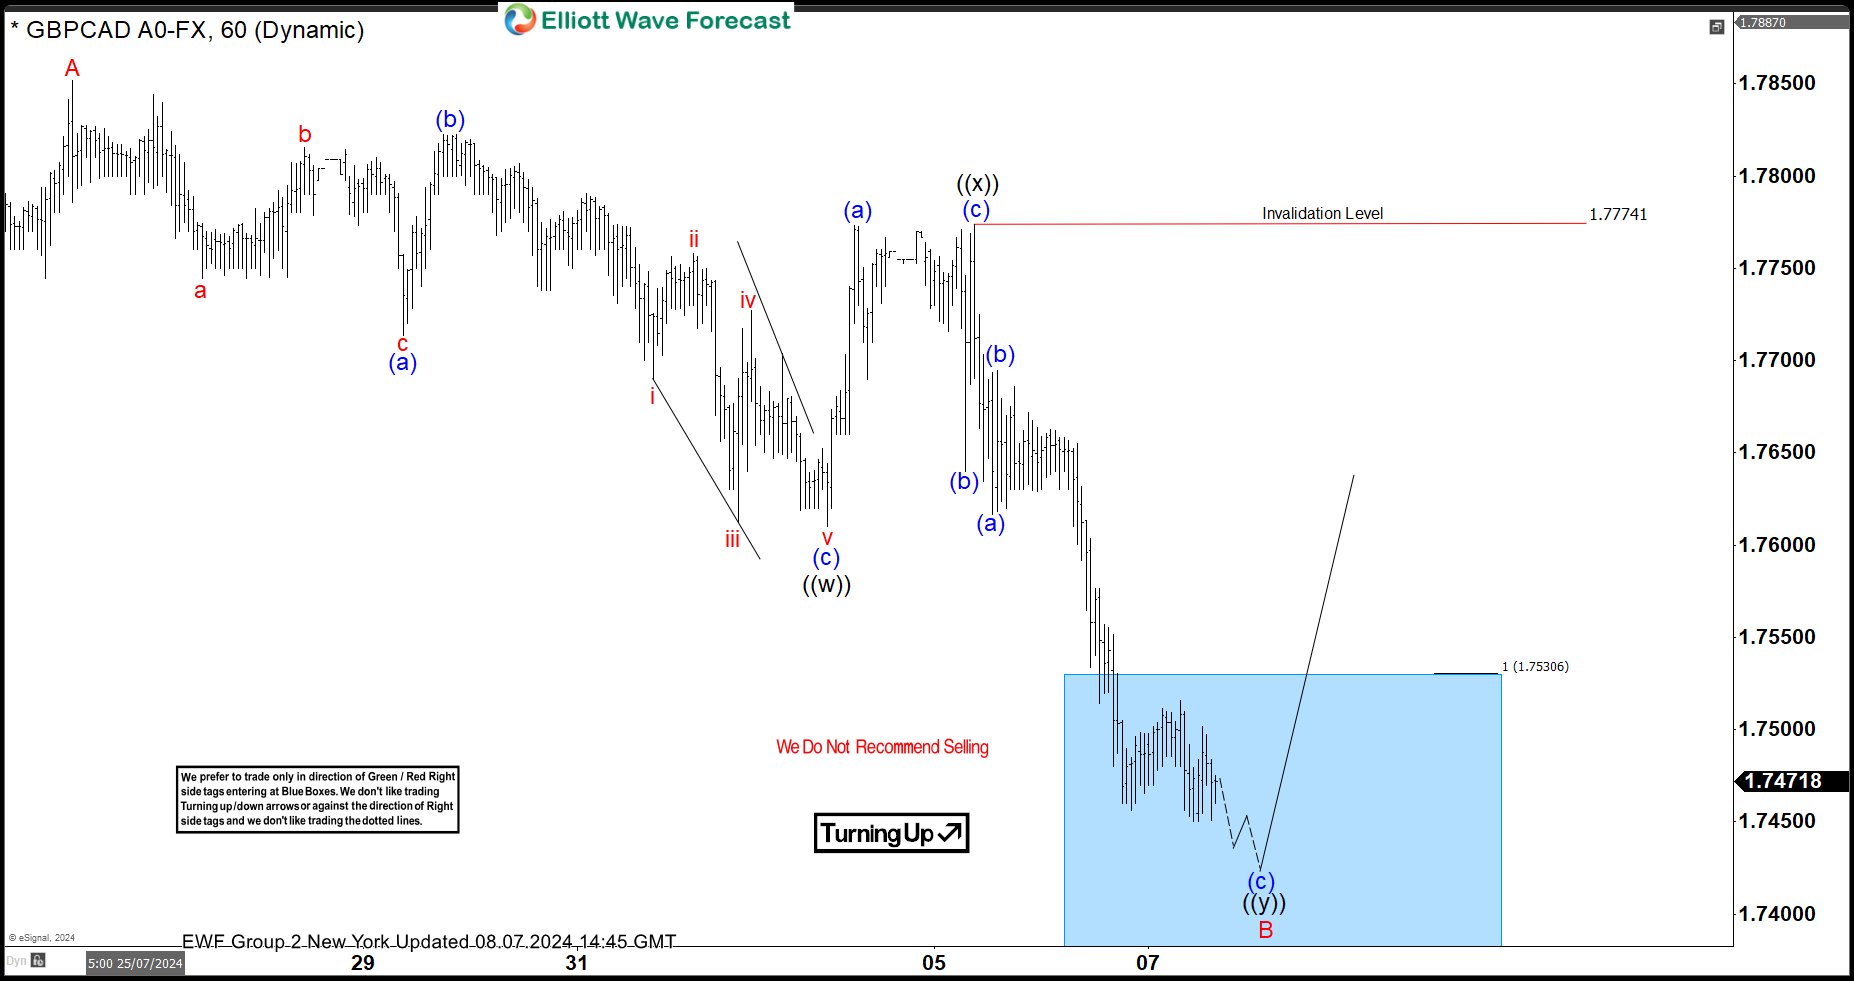
GBPCAD Reacted Higher After Ending Double Correction Lower
Read MoreIn this blog, we take a look at the past 1 hour Elliott Wave charts of GBPCAD. In which, the pair reacted higher after ending double correction.