
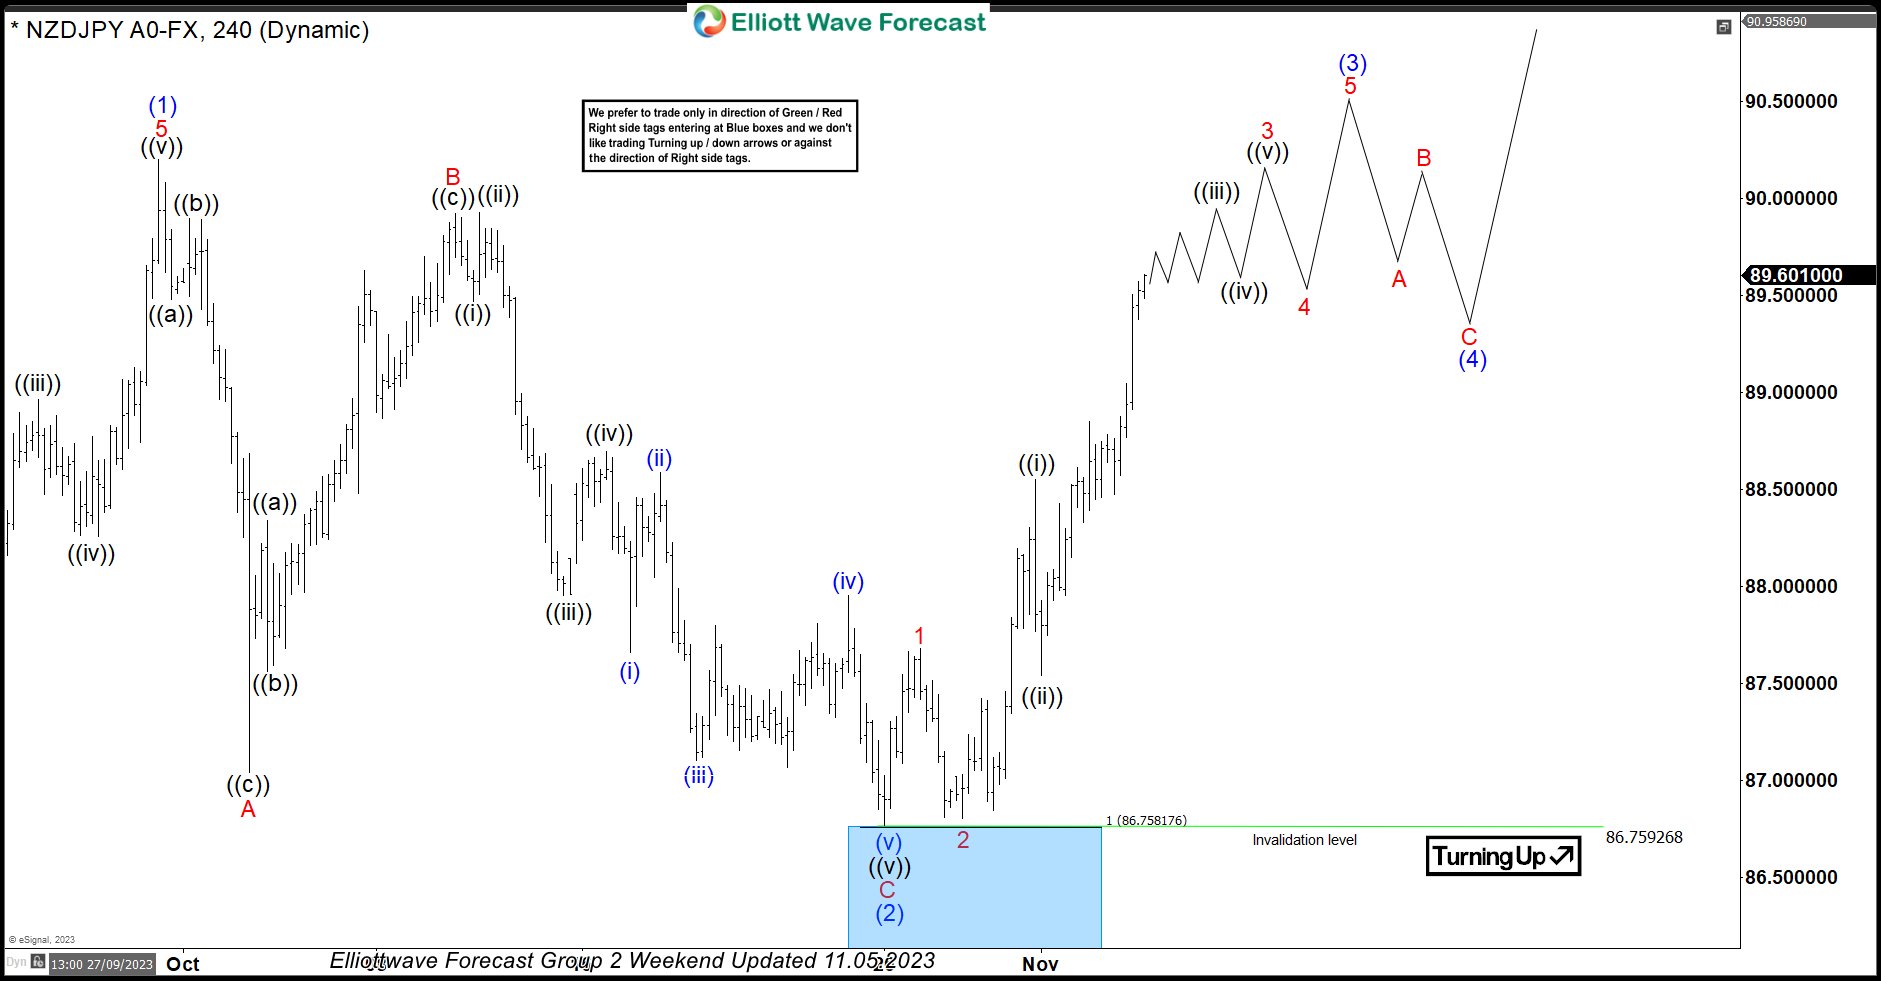
In this technical blog, we will look at the past performance of the 4-hour Elliott Wave Charts of NZDJPY. In which, the rally from 24 March 2023 low unfolded as an impulse sequence and showed a higher high sequence. Therefore, we knew that the structure in NZDJPY is incomplete to the upside & should extend higher. So, […]
-
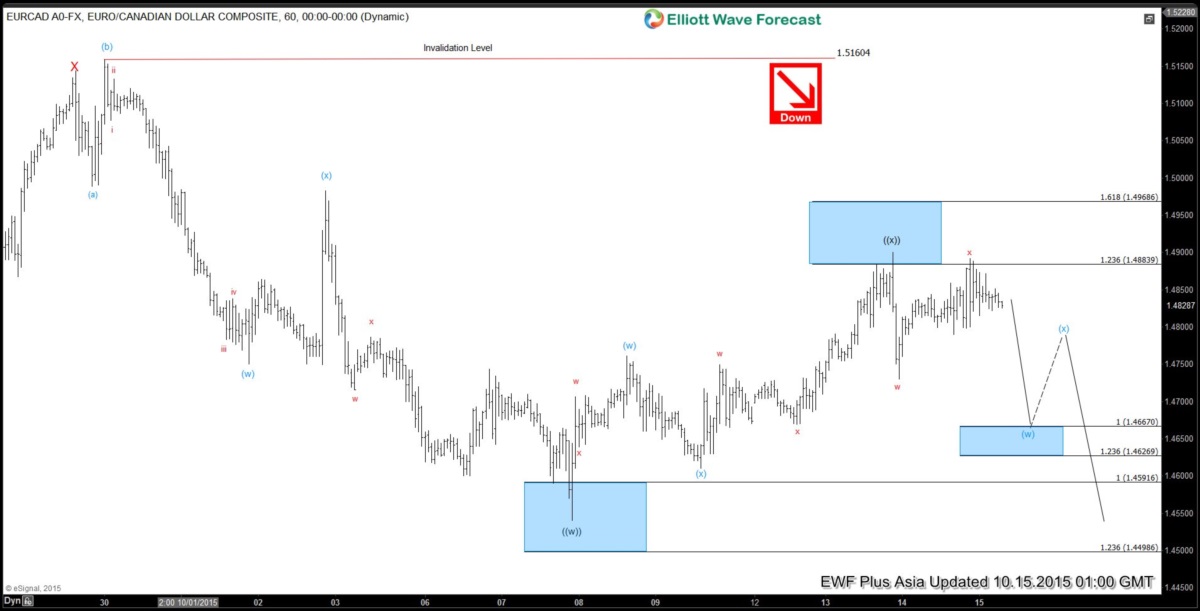
EURCAD Short Term Elliott Wave Update 10.15.2015
Read MoreBest reading of the cycle in the short term suggests decline to 1.454 ended wave ((w)). Wave ((x)) bounce is unfolding as a double three structure where wave (w) ended at 1.476, wave (x) ended at 1.461, and wave (y) of ((x)) is proposed complete at 1.49. While below 1.49, or more importantly as far as […]
-
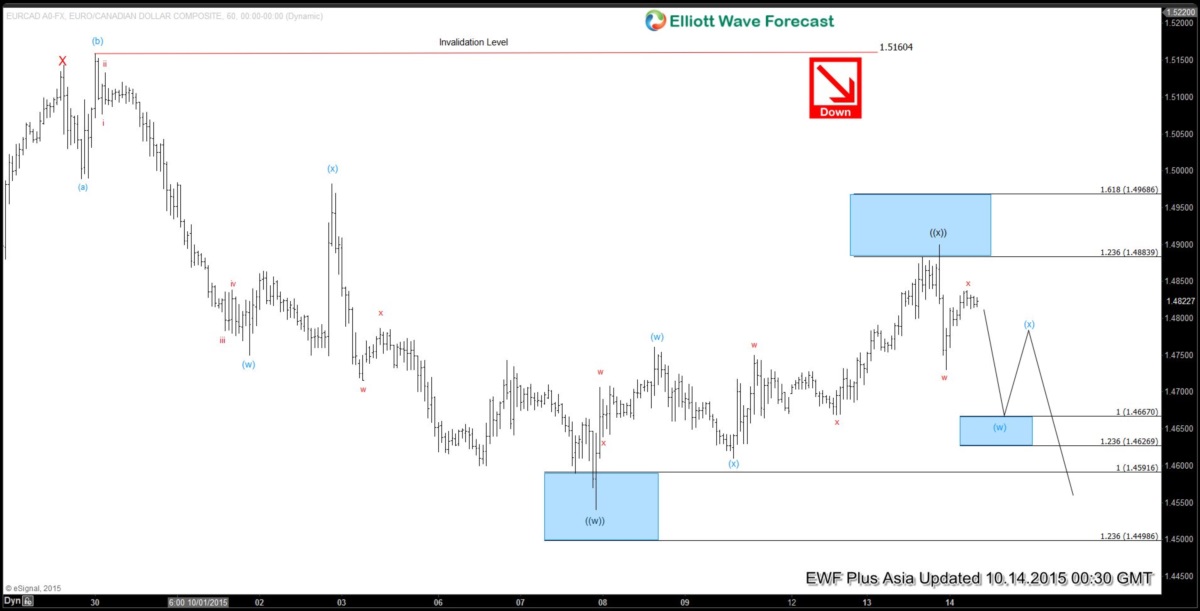
EURCAD Short Term Elliott Wave Update 10.14.2015
Read MoreBest reading of the cycle in the short term suggests decline to 1.454 ended wave ((w)). Wave ((x)) bounce is unfolding as a double three structure where wave (w) ended at 1.476, wave (x) ended at 1.461, and wave (y) of ((x)) is proposed complete at 1.49. While below 1.49, or more importantly as far as […]
-
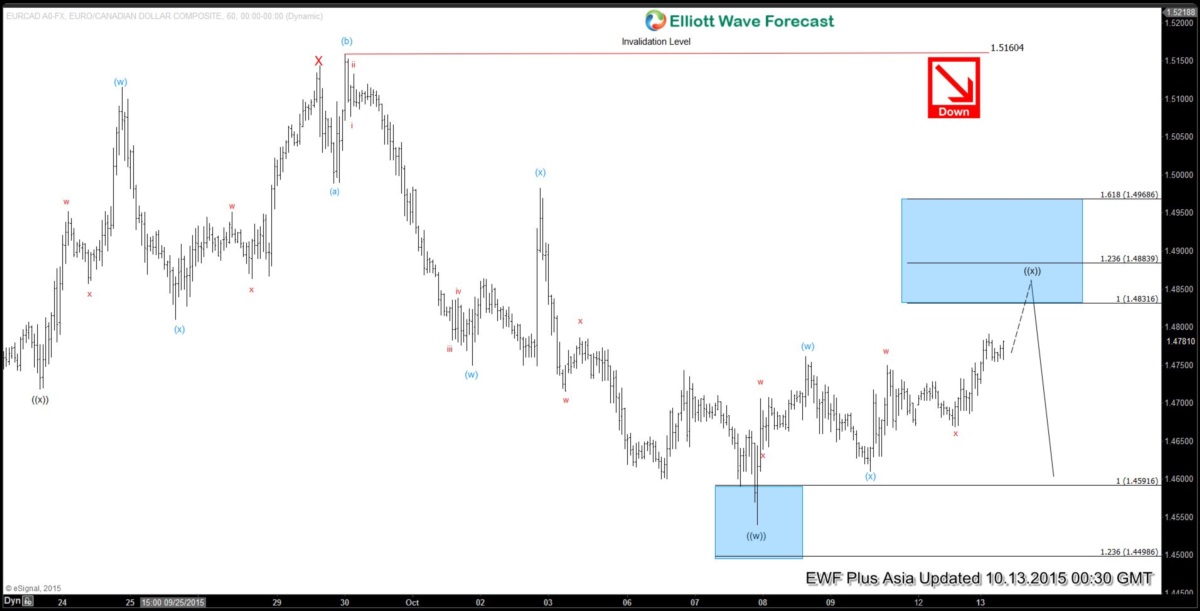
EURCAD Short Term Elliott Wave Analysis 10.12.2015
Read MoreBest reading of the cycle in the short term suggests decline to 1.454 ended wave ((w)). Wave ((x)) bounce is unfolding as a double three structure where wave (w) ended at 1.476, wave (x) ended at 1.461, and wave (y) of ((x)) is in progress towards 1.483 – 1.488 area before the pair turns either […]
-
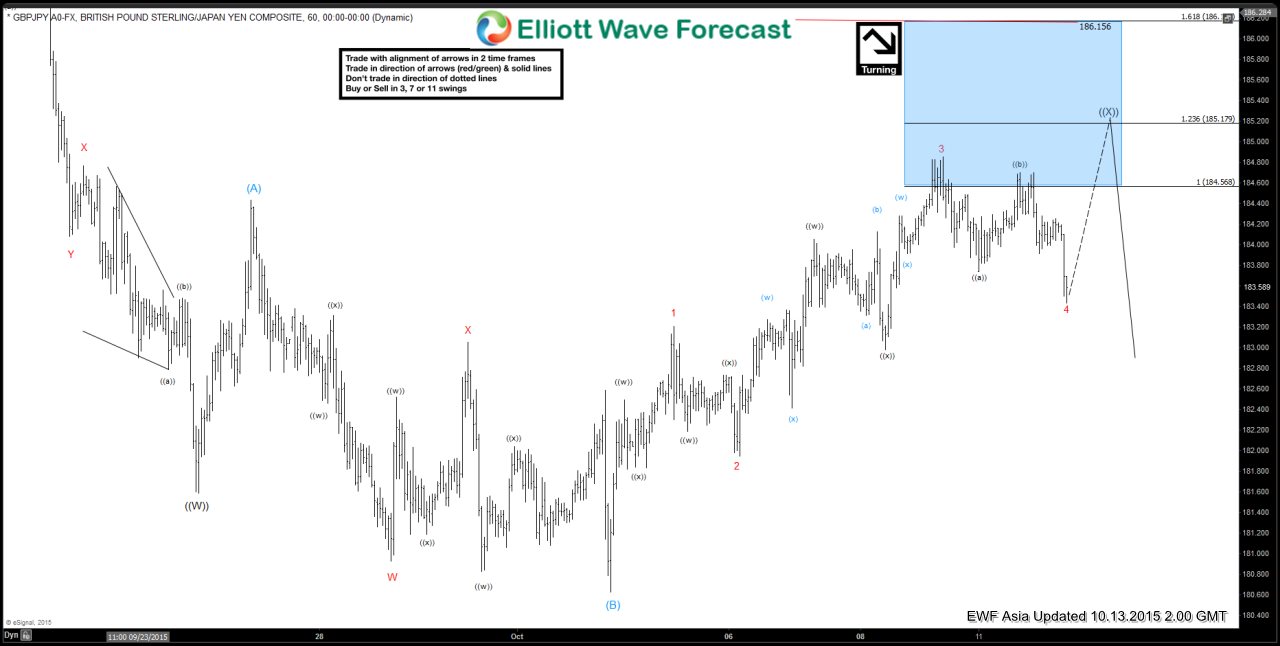
$GBPJPY Trading Plan Recap Oct 13 2015
Read MoreHere is a quick blog from our Live Trading Room host, Dan Hussey. Take a look at how to manage your risk by using inflection zones and Elliot Wave to your advantage. The Live Trading Room is held daily at 8:00 AM EST , join Dan there for more insight into these proven methods of trading. GBP/JPY Live Trading […]
-
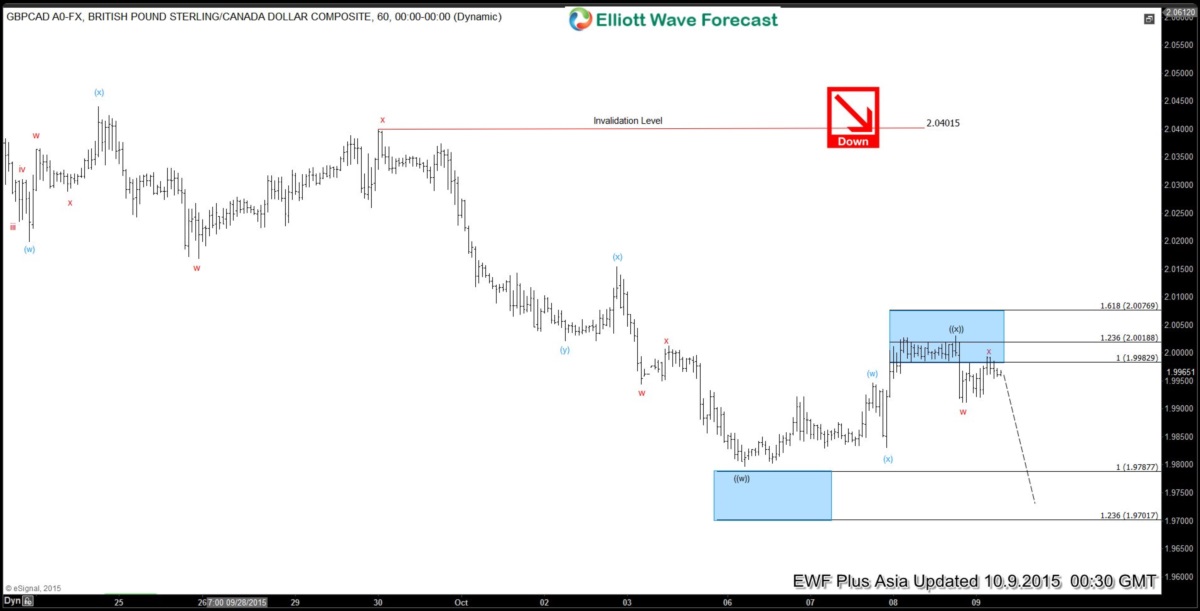
GBPCAD Short Term Elliott Wave Update 10.9.2015
Read MoreBest reading of the cycle suggests that rally to 2.057 ended wave X. From this level, the pair resumed the decline in wave ((w)) as a double three structure wxy where wave w ended at 2.0168, wave x ended at 2.04, and wave y of ((w)) completed at 1.98. Wave ((x)) bounce unfolded also in double three […]
-
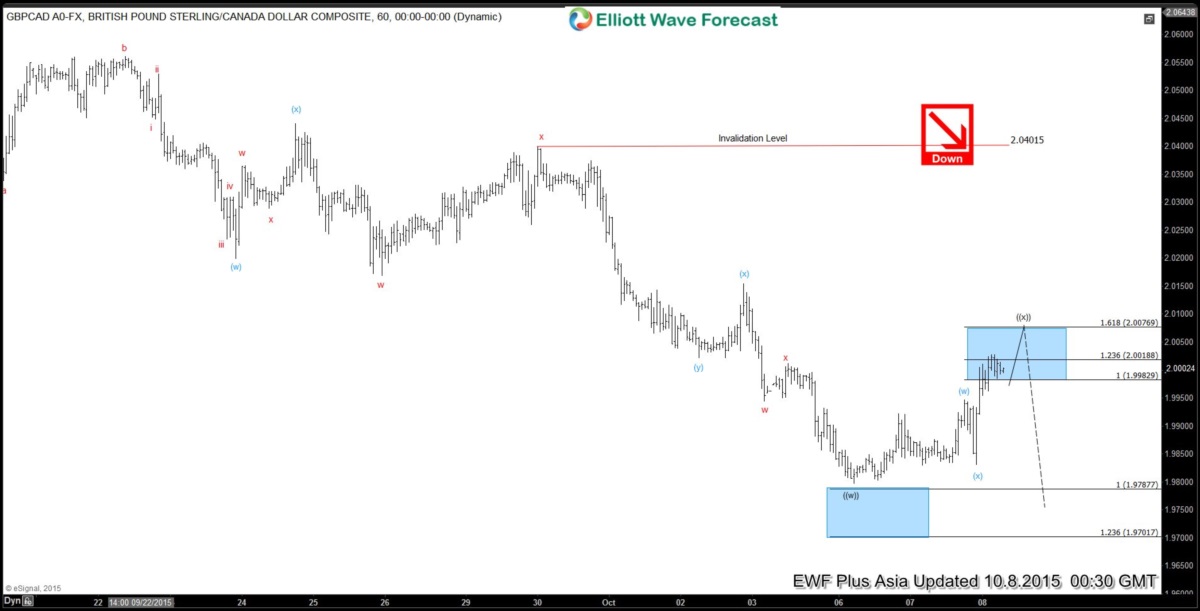
GBPCAD Short Term Elliott Wave Update 10.8.2015
Read MoreBest reading of the cycle suggests that rally to 2.057 ended wave X. From this level, the pair resumed the decline in wave ((w)) as a double three structure wxy where wave w ended at 2.0168, wave x ended at 2.04, and wave y of ((w)) completed at 1.98. Wave ((x)) bounce is currently in progress […]