
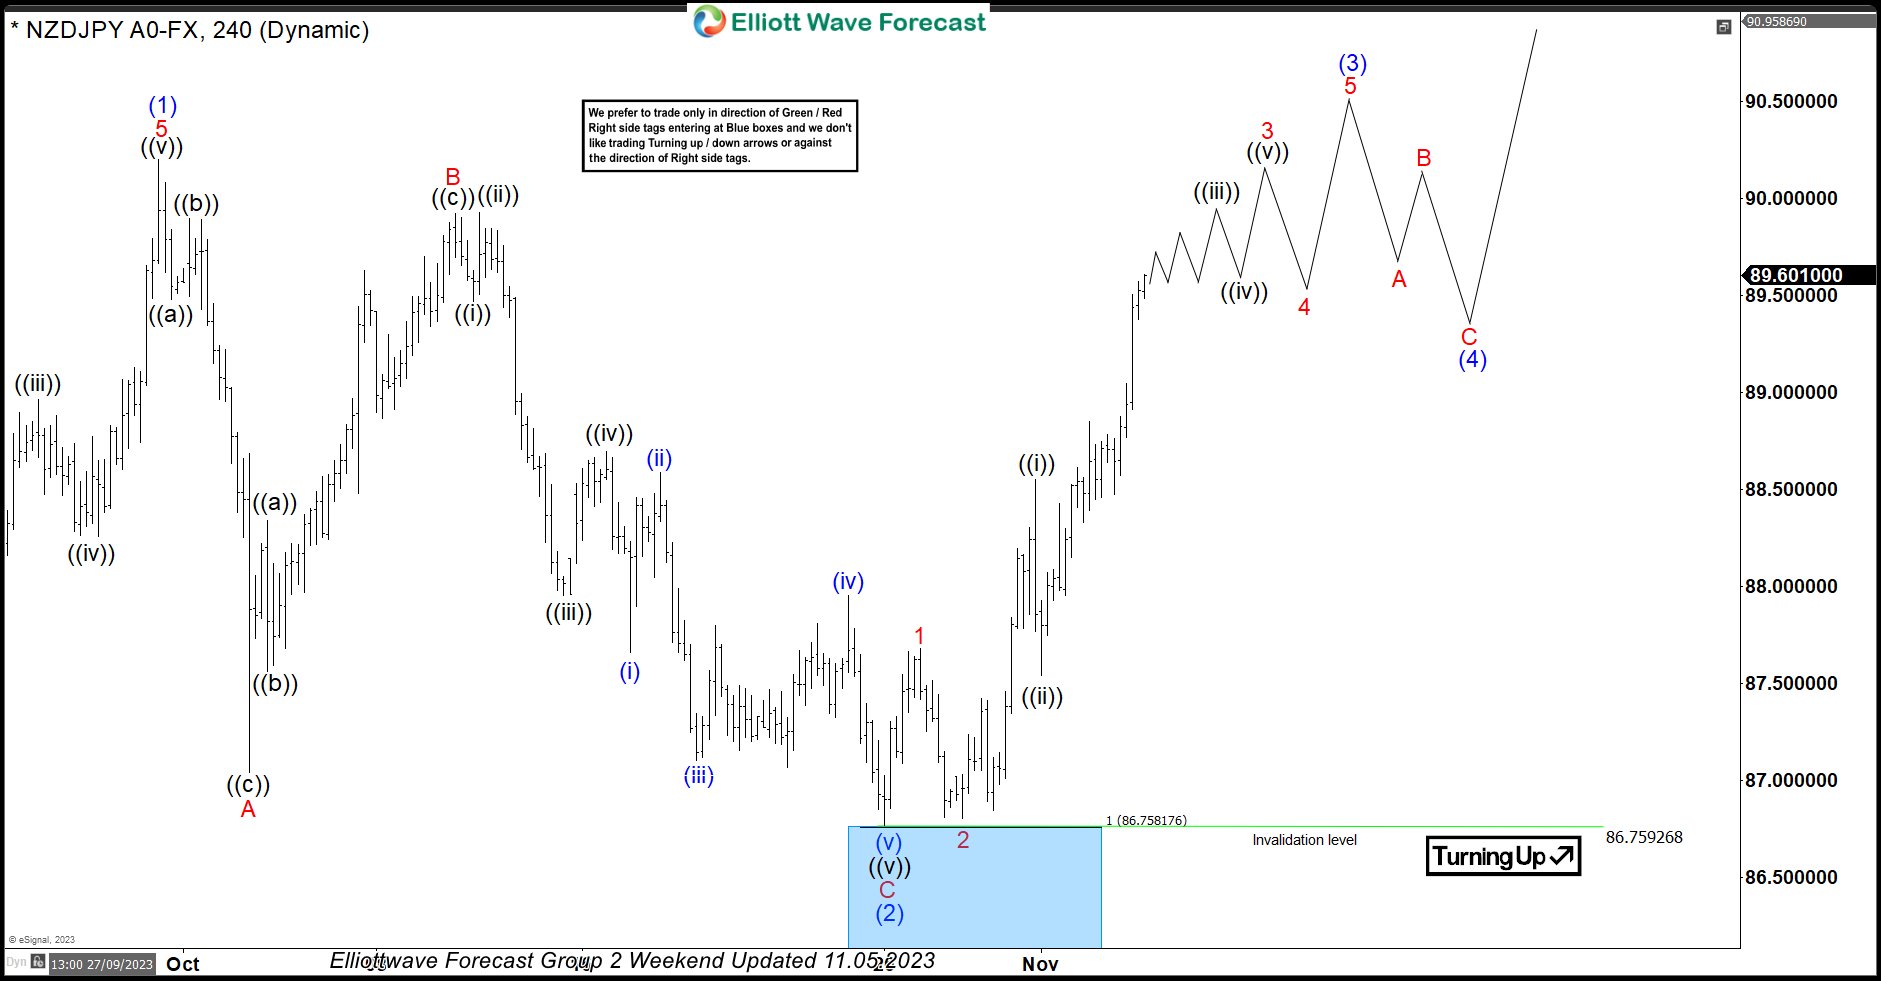
In this technical blog, we will look at the past performance of the 4-hour Elliott Wave Charts of NZDJPY. In which, the rally from 24 March 2023 low unfolded as an impulse sequence and showed a higher high sequence. Therefore, we knew that the structure in NZDJPY is incomplete to the upside & should extend higher. So, […]
-
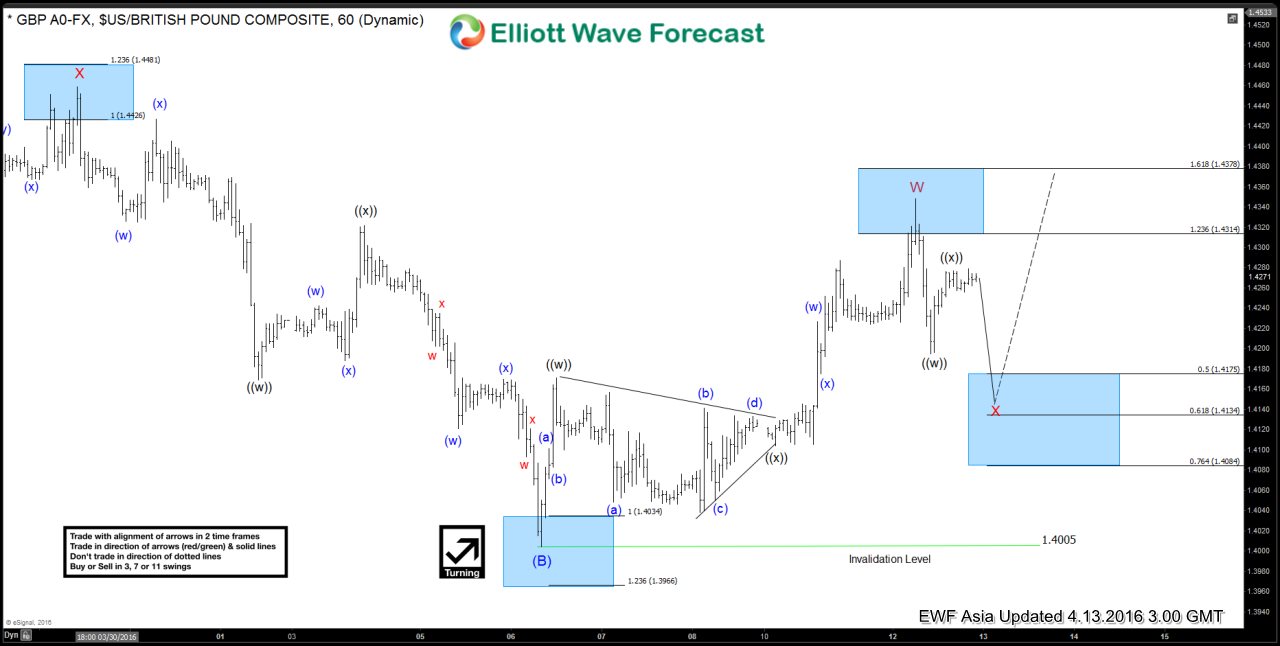
GBPUSD Short-term Elliott Wave Analysis 4.13.2016
Read MoreShort term Elliottwave structure suggests that the decline to 1.4 ended wave (B) of a larger degree triangle. Wave (C) rally is unfolding as a double three where wave W ended at 1.4348, and wave X pullback is in progress to correct the rally from 1.4 in 3, 7, or 11 swing before turning higher again. […]
-
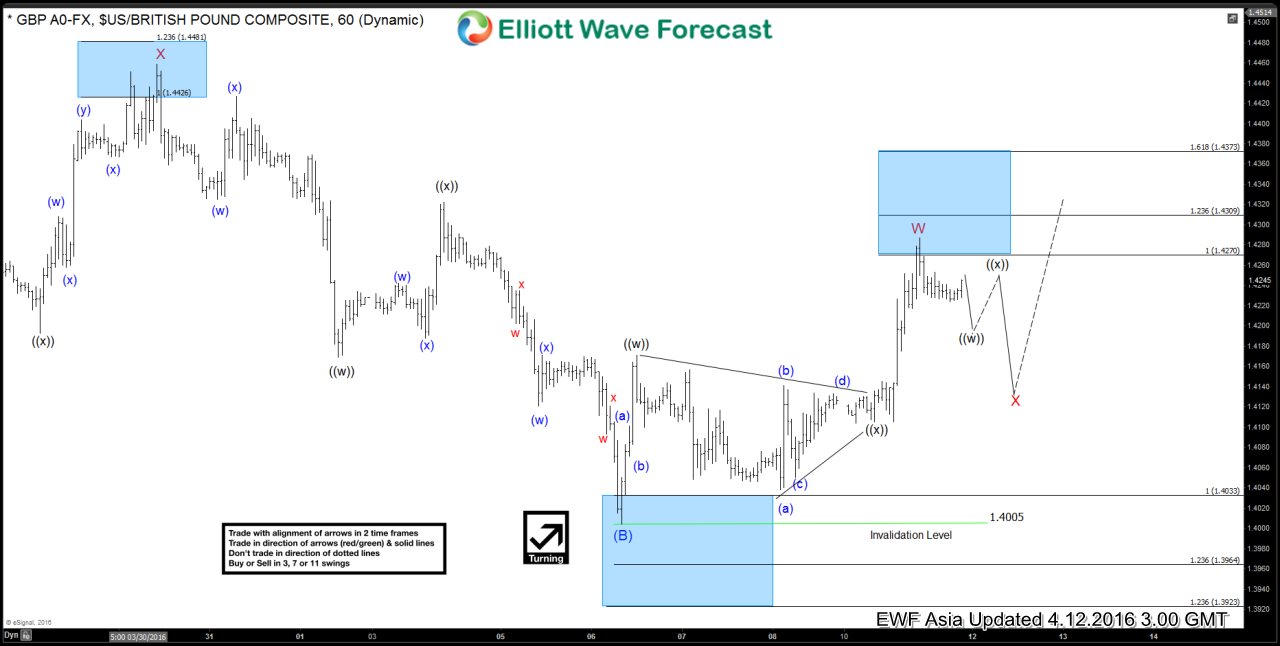
GBPUSD Short-term Elliott Wave Analysis 4.12.2016
Read MoreShort term Elliottwave structure suggests that the decline to 1.4 ended wave (B) of a larger degree triangle. Wave (C) rally is unfolding as a double three where wave W ended at 1.4287, and wave X pullback is in progress to correct the rally from 1.4 in 3, 7, or 11 swing before turning higher again. […]
-
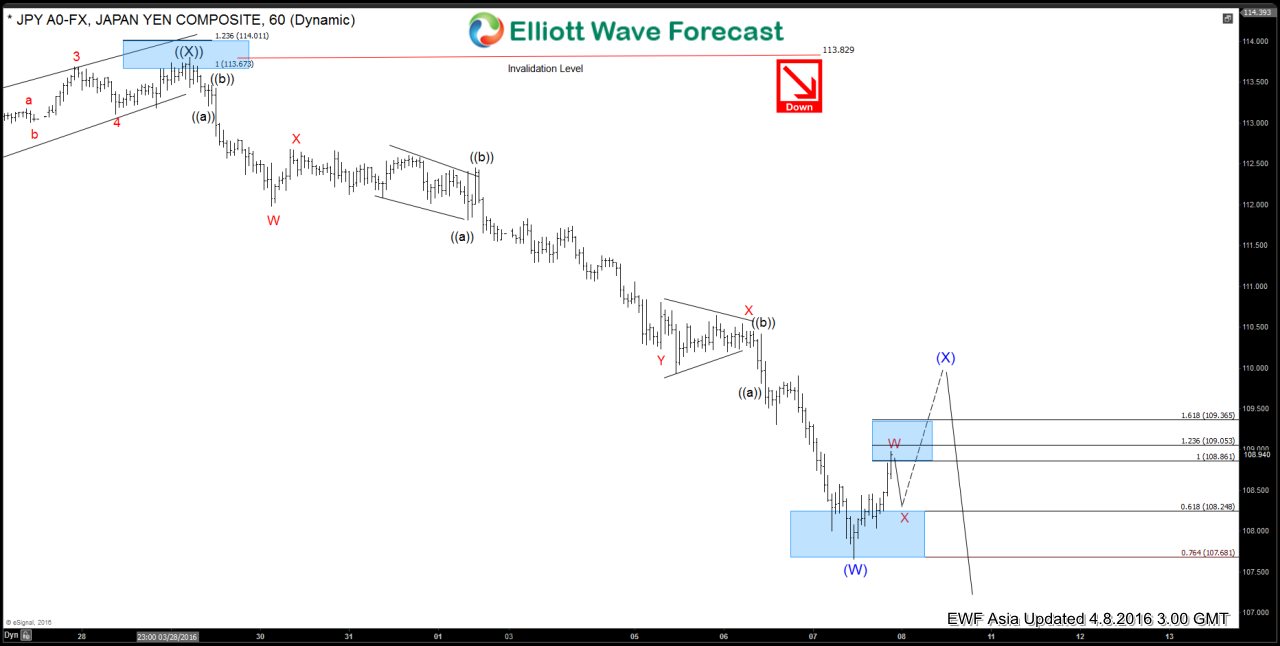
USDJPY Short-term Elliott Wave Analysis 4.8.2016
Read MoreRevised short term Elliottwave structure suggests that rally to 113.8 ended wave ((X)). Wave (W) decline from there has an internal of a triple correction (WXYZ) structure where wave W ended at 111.98, wave X ended at 112.67, wave Y ended at 110.23, 2nd wave X ended at 110.54, and wave Z of (W) is proposed complete at 107.66. Wave (X) bounce […]
-
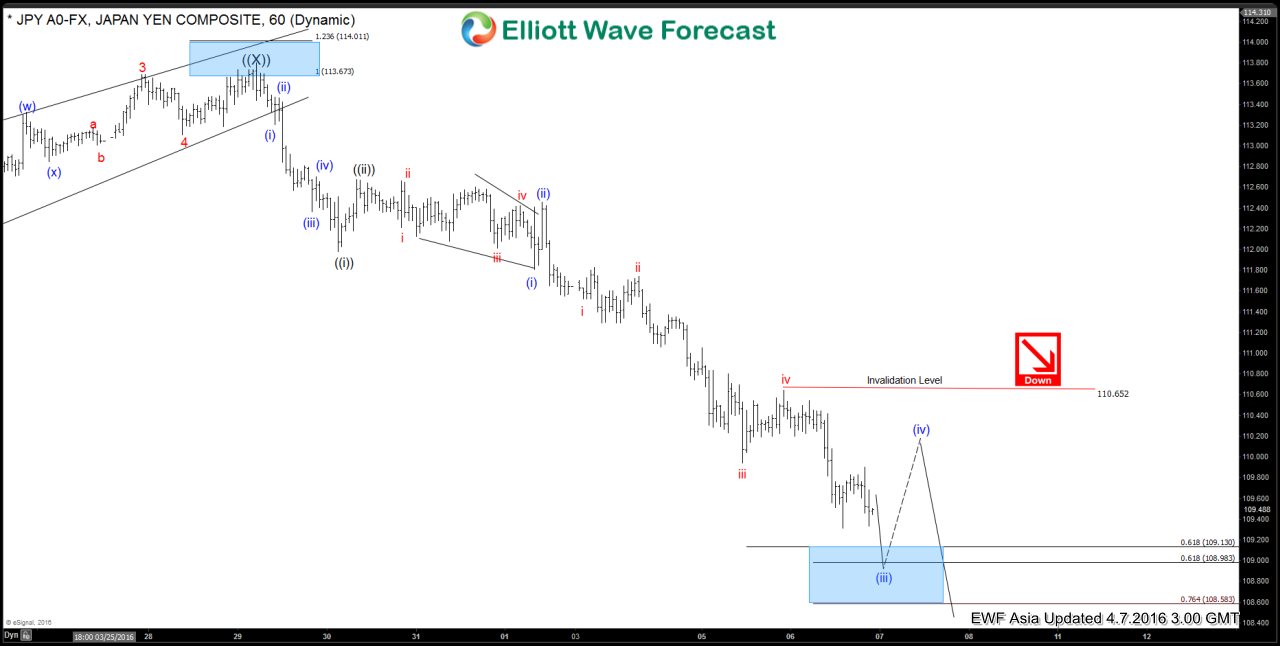
USDJPY Short-term Elliott Wave Analysis 4.7.2016
Read MoreRevised short term Elliottwave structure suggests decline from wave ((X)) at 113.8 is unfolding as an impulse 5 waves structure where wave ((i)) ended at 111.98, wave ((ii))) ended at 112.67, and wave ((iii)) is in progress. Internal of wave ((iii)) is also in impulsive structure and wave (iii) of ((iii)) is expected to complete at 108.58 […]
-
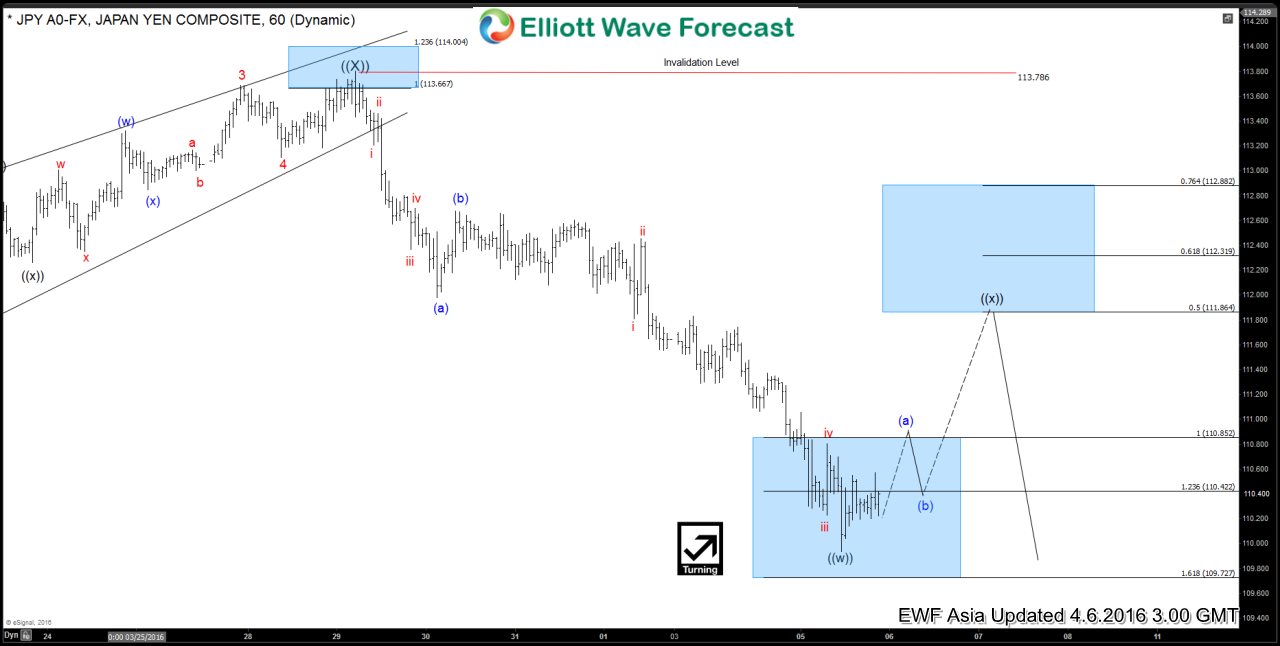
USDJPY Short-term Elliott Wave Analysis 4.6.2016
Read MoreShort term Elliottwave structure suggests decline from wave ((X)) at 113.8 is unfolding as a zig zag structure (5-3-5 structure) where wave (a) ended at 111.98, wave (b) ended at 112.67, and wave (c) of ((w)) is proposed complete at 109.93. Pair is currently correcting the decline from 113.786 in wave ((x)) towards 111.86 – 112.31 […]
-
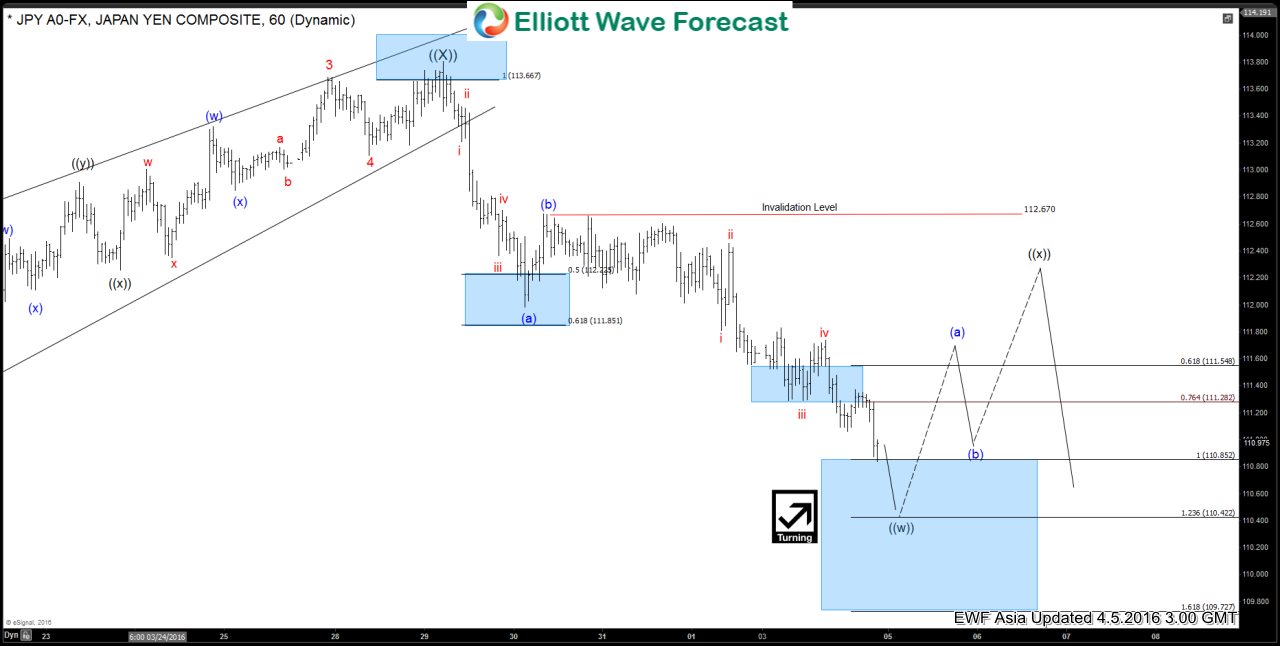
USDJPY Short-term Elliott Wave Analysis 4.5.2016
Read MoreShort term Elliottwave structure suggests decline from wave ((X)) at 113.8 is unfolding as a zig zag structure (5-3-5 structure) where wave (a) ended at 111.98, wave (b) ended at 112.67, and wave (c) of ((w)) is in progress as 5 waves and expected to complete at 110.42 – 110.85 area before a bounce in wave […]