
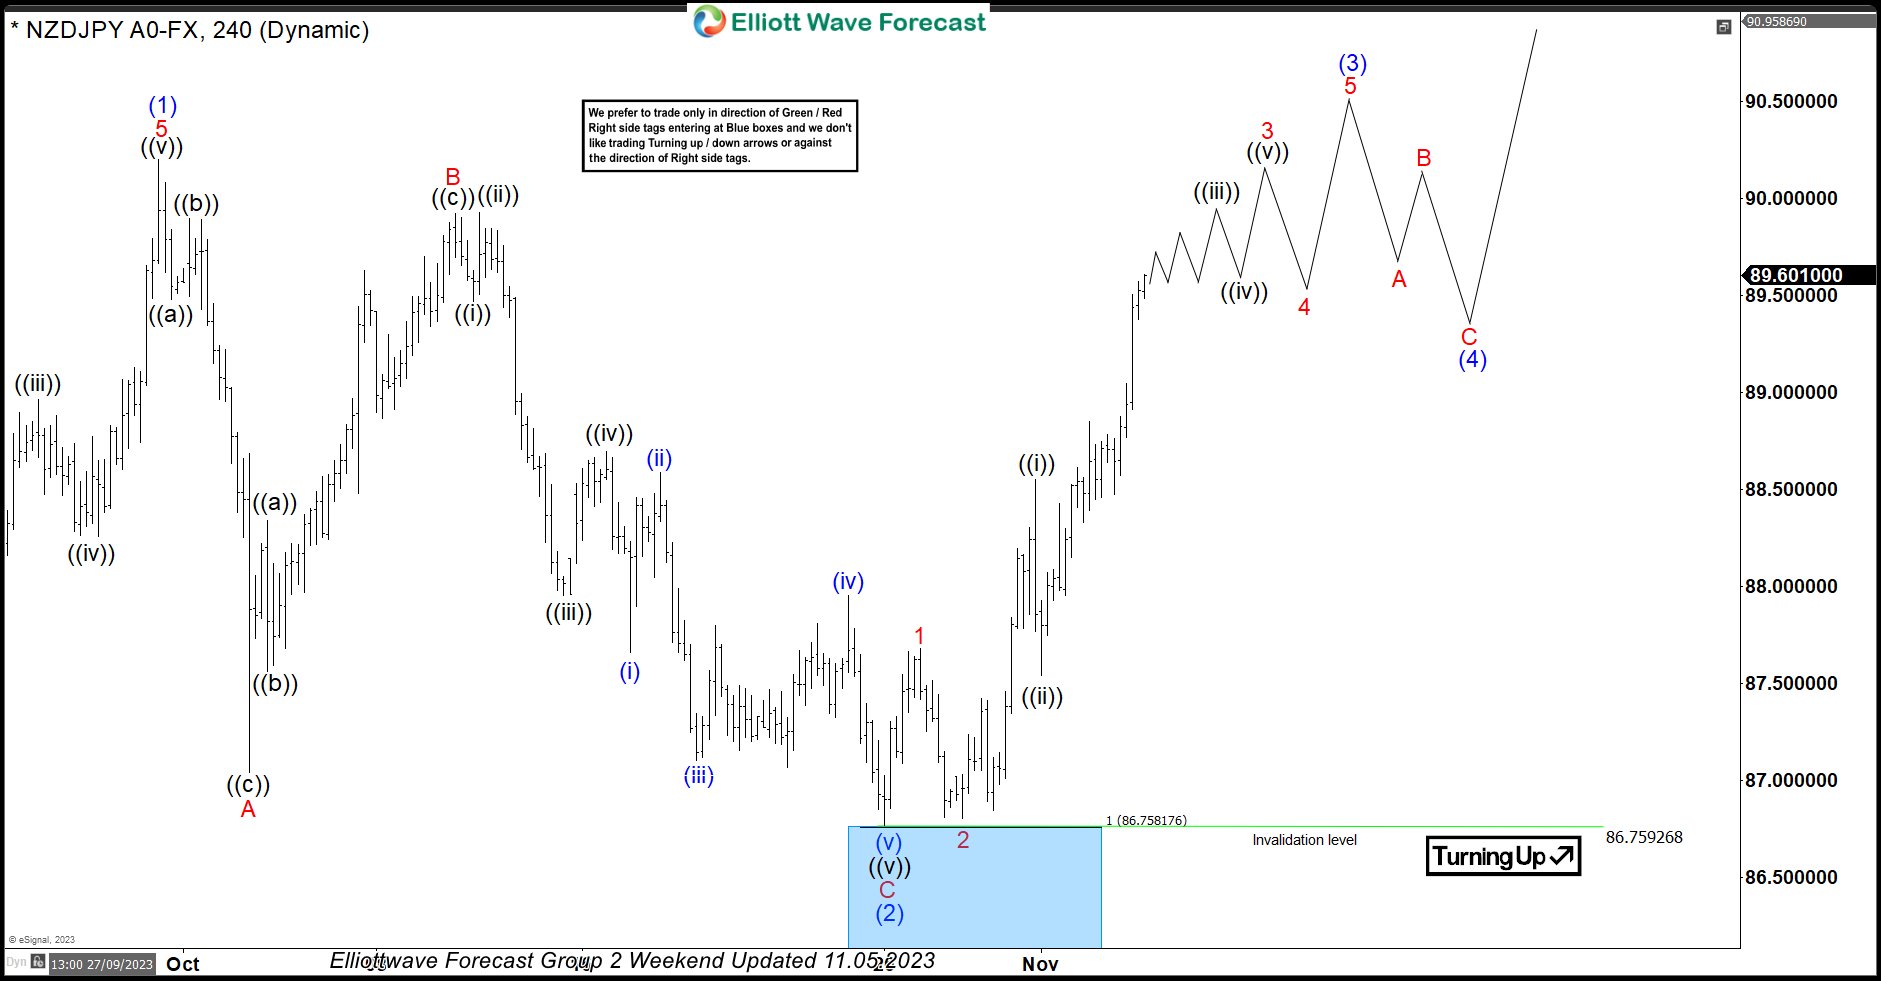
In this technical blog, we will look at the past performance of the 4-hour Elliott Wave Charts of NZDJPY. In which, the rally from 24 March 2023 low unfolded as an impulse sequence and showed a higher high sequence. Therefore, we knew that the structure in NZDJPY is incomplete to the upside & should extend higher. So, […]
-
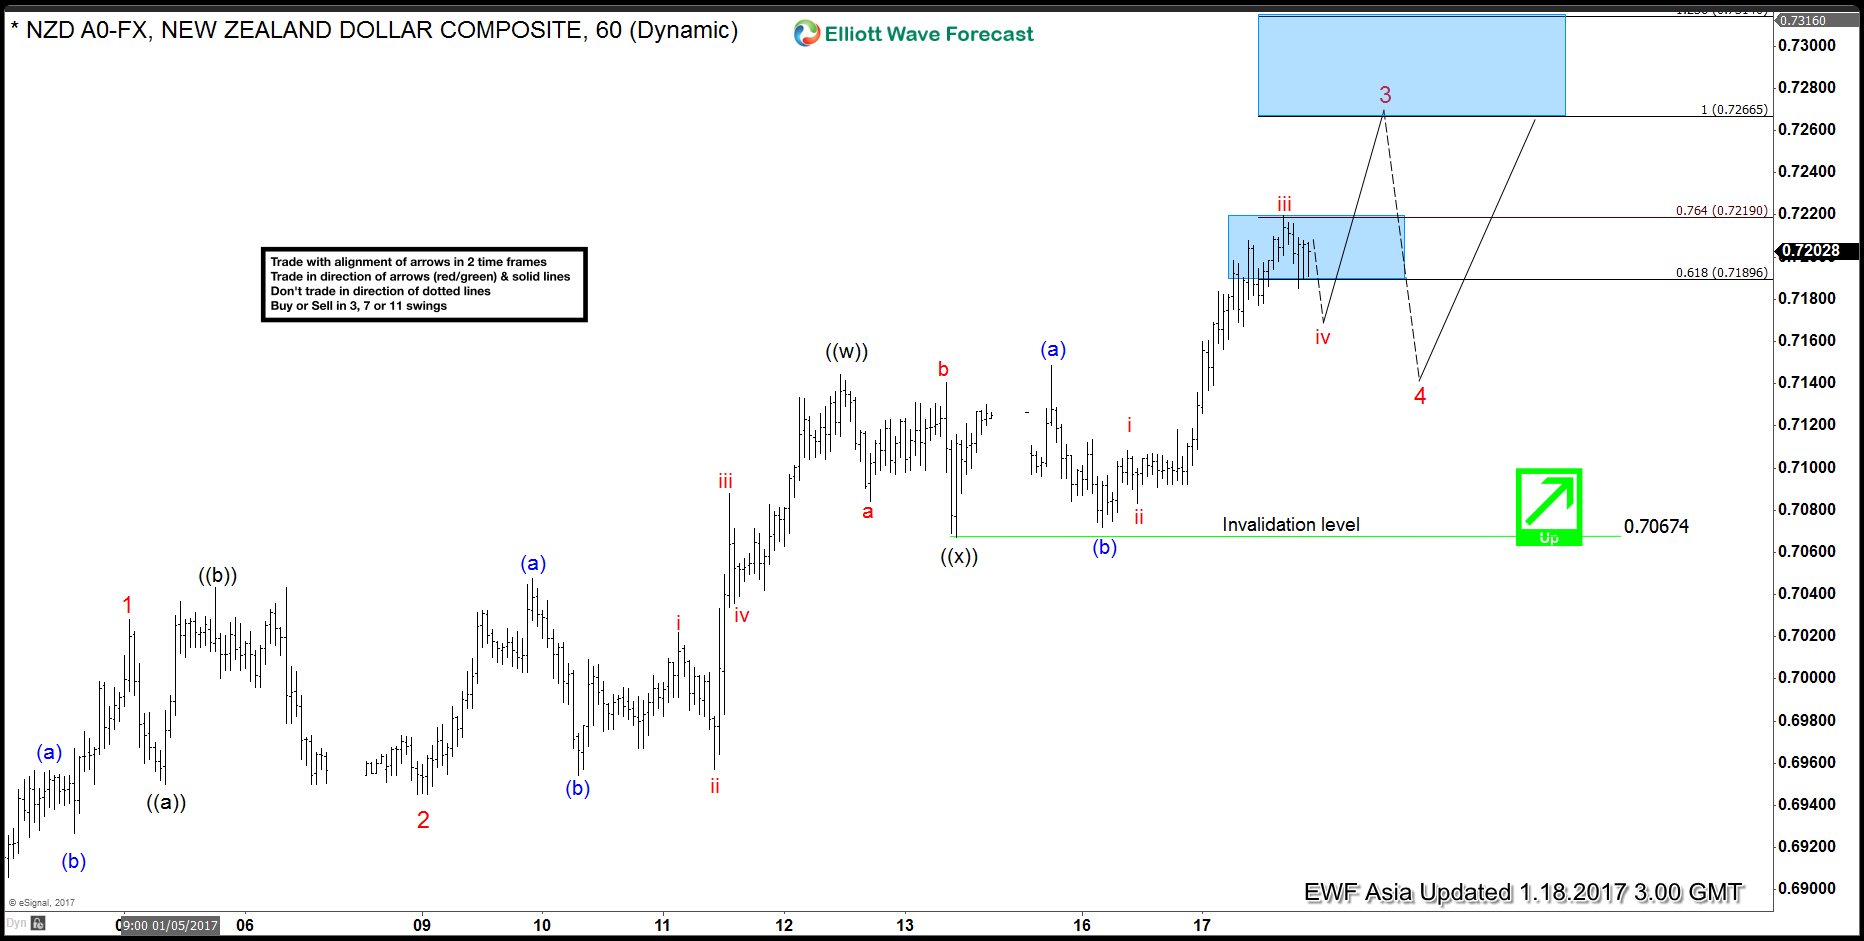
NZDUSD – Possible diagonal move in making
Read MoreNZDUSD move up from 12/23 low is extending and it looks like the move up from 12/23 low is unfolding as an Elliott wave diagonal when pair is still in wave 3. Rally to 0.7028 is labelled as wave 1 and dip to 0.6945 is labelled as a FLAT wave 2. Up from there wave 3 […]
-

NZDCAD Elliottwave Analysis 1/17/2017
Read MoreFor more analysis in other Forex, Indices, and Commodities, take our 14 days FREE trial and get access to Elliottwave charts for 52 instrument in 4 time frames, live sessions, live trading room, 24 hour chat room, and more. Weekly Chart NZDCAD is showing a bullish sequence in the weekly time frame with the break […]
-
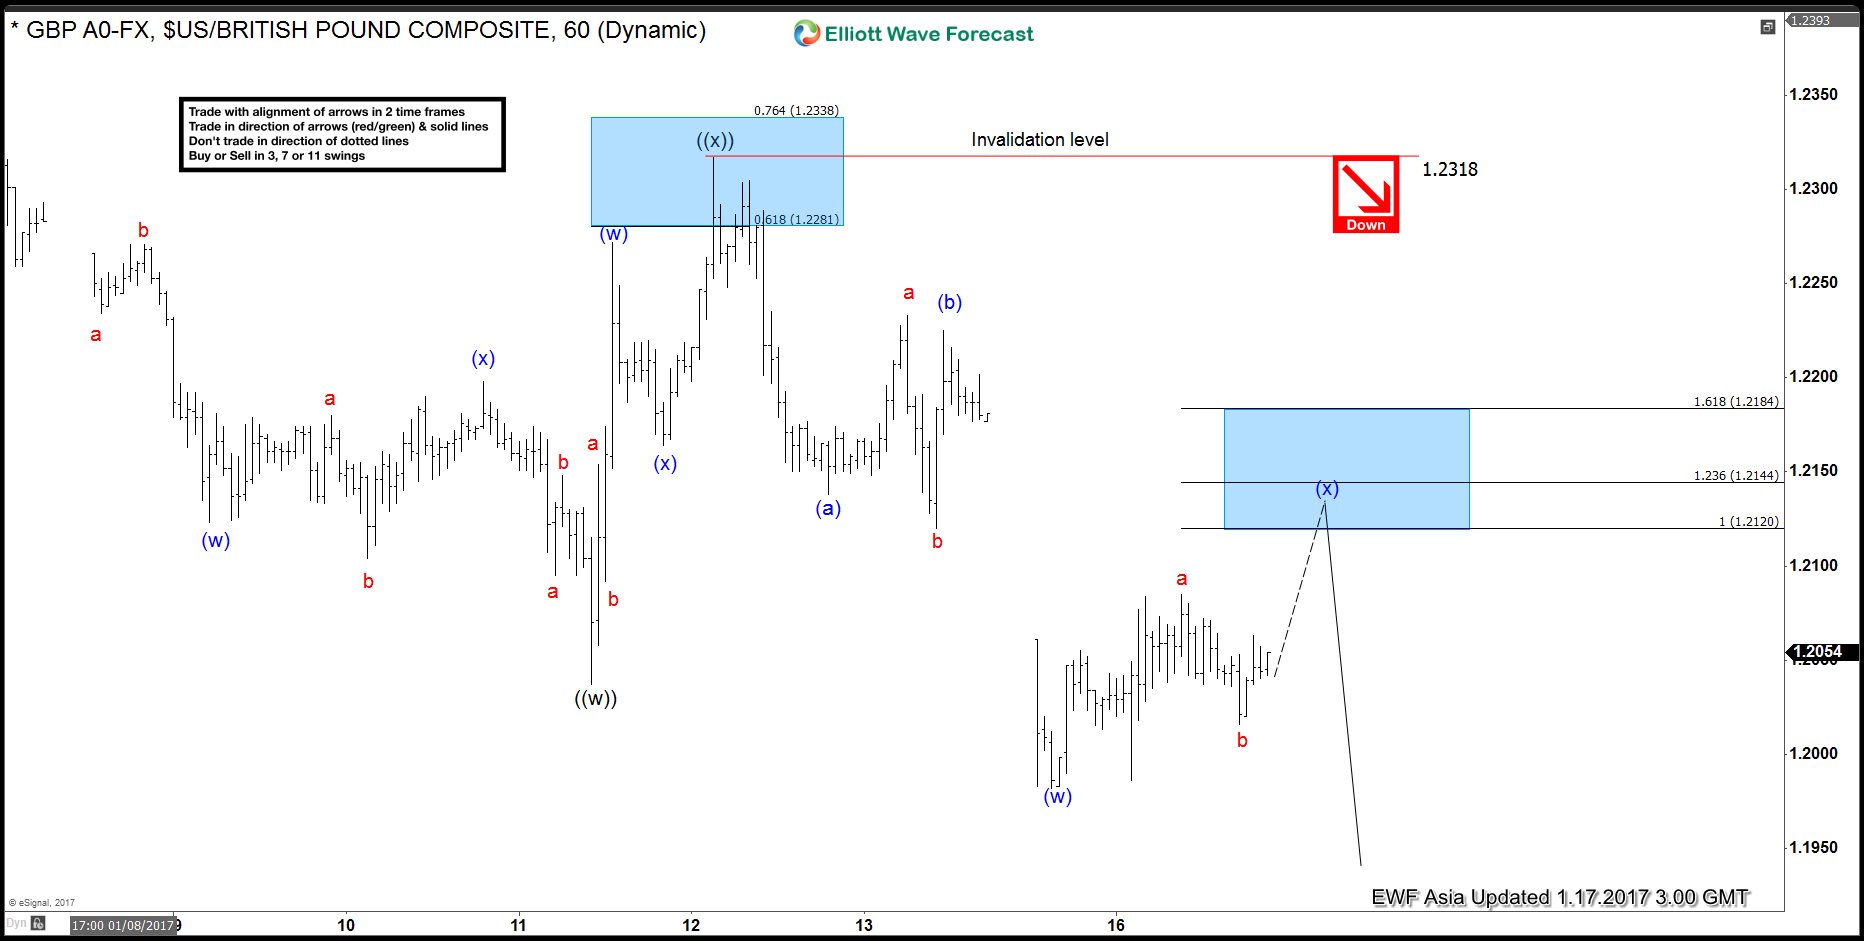
GBPUSD Elliott Wave Forecast 1.17.2017
Read MoreGBPUSD is showing a 5 swing bearish sequence from 12/6 peak (1.277) which favors more downside. The decline from 12/6 peak is unfolding as a double three where wave W ended at 1.2198 and wave X ended at 1.2432. Internal of wave (Y) is unfolding as a double three where wave ((w)) ended at 1.2037 and wave […]
-
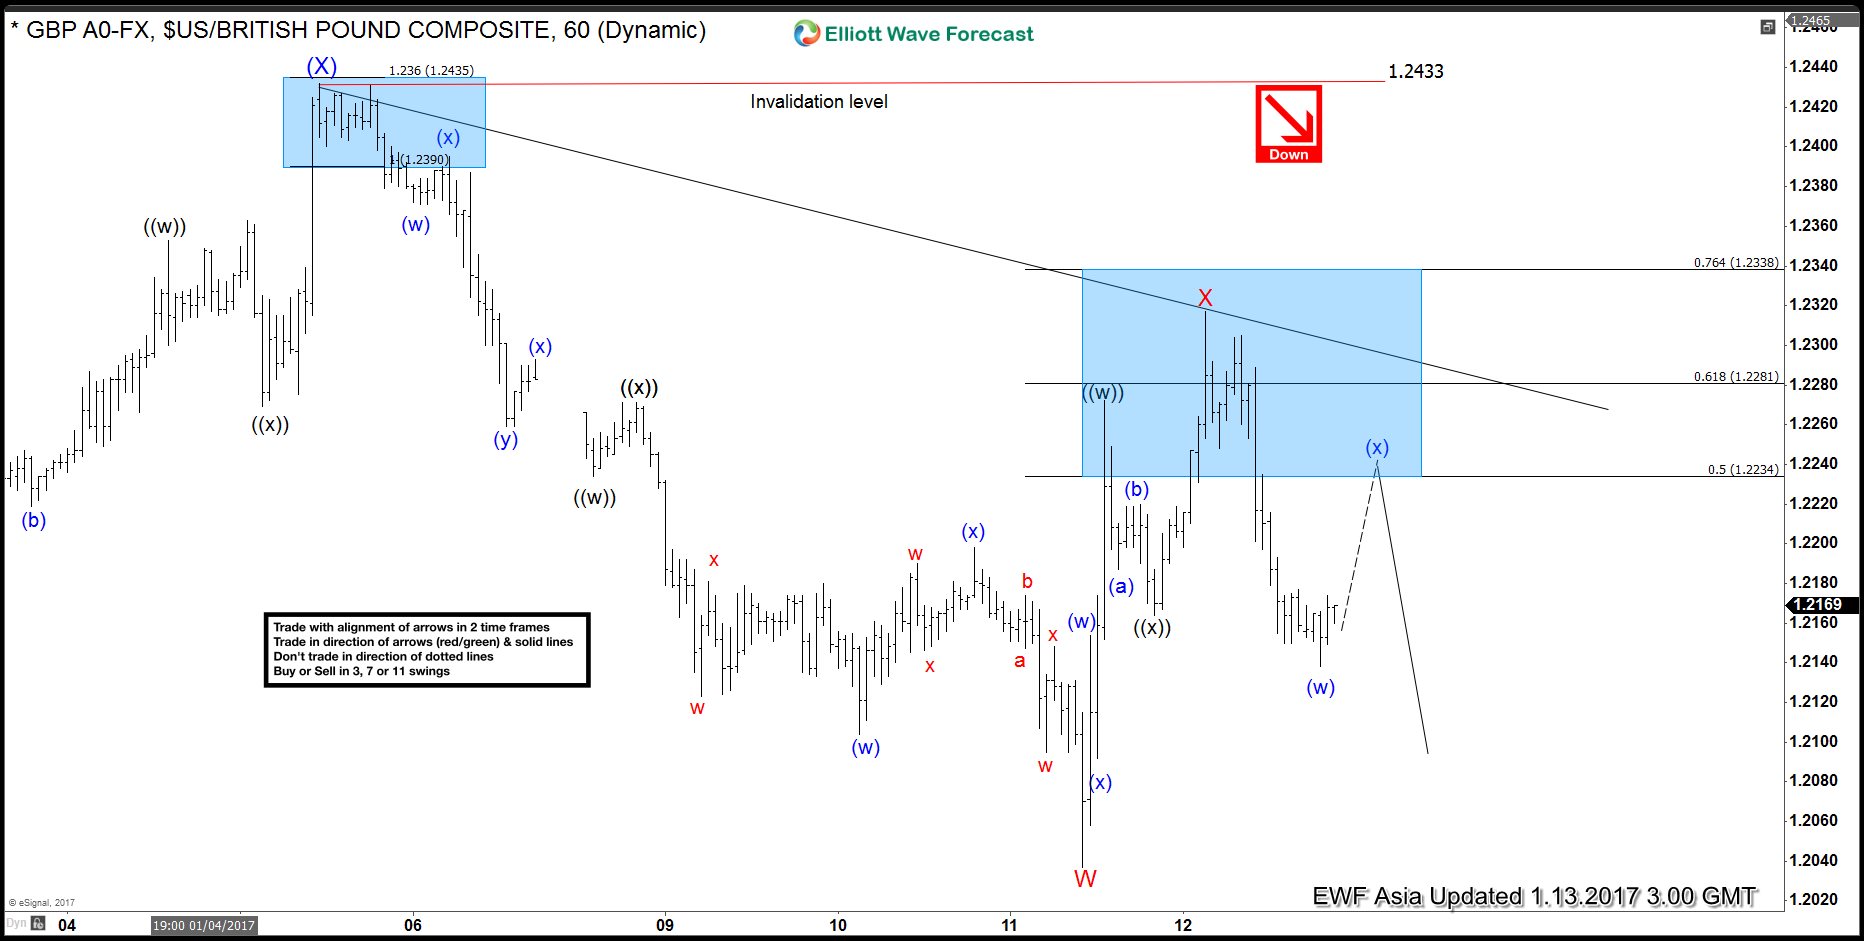
GBPUSD Elliott Wave Forecast 1.13.2017
Read MoreGBPUSD is showing a 5 swing bearish sequence from 12/6 peak (1.277) which favors more downside. The decline from 12/6 peak is unfolding as a double three where wave (W) ended at 1.2198 and wave (X) ended at 1.2432. GBPUSD has since broken below wave (W) at 1.2198 which suggests that the next leg Wave (Y) […]
-
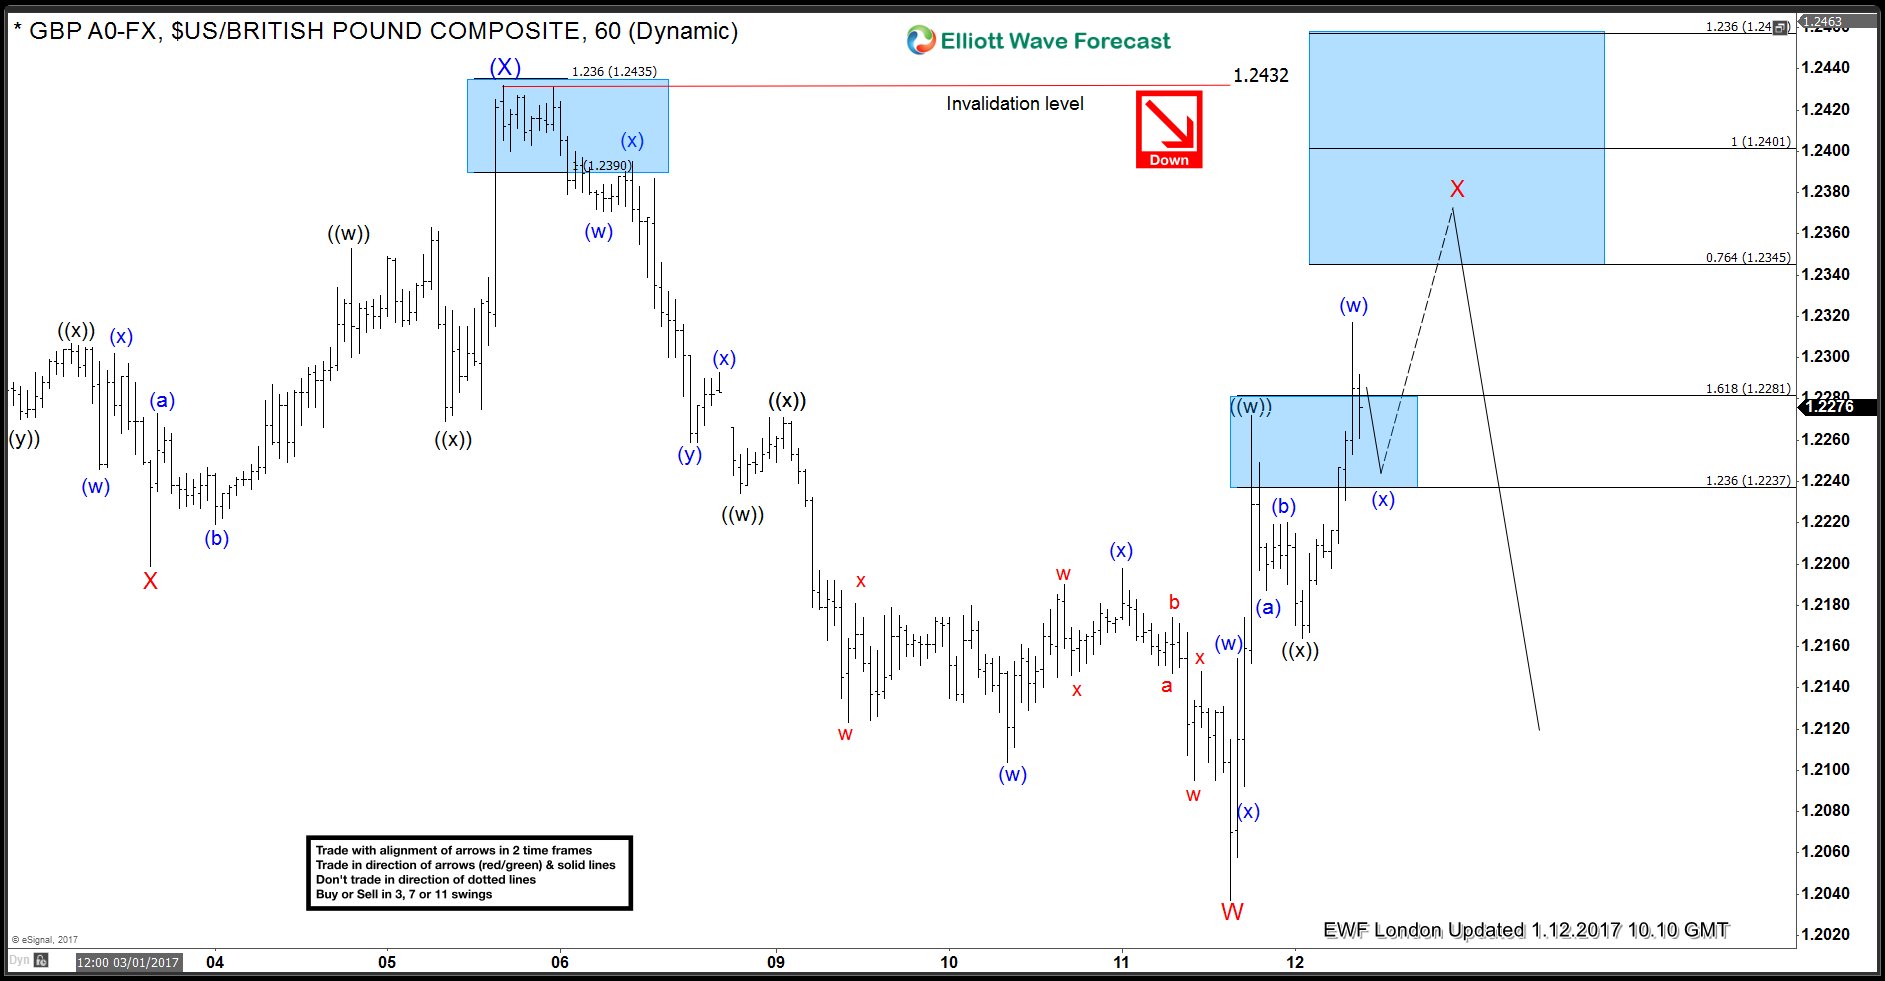
GBPUSD Elliott Wave Forecast 1.12.2017
Read MoreGBPUSD is showing a 5 swing bearish sequence from 12/6 peak (1.277) which favors more downside. The decline from 12/6 peak is unfolding as a double three where wave (W) ended at 1.2198 and wave (X) ended at 1.2432. GBPUSD has since broken below wave (W) at 1.2198 which suggests that the next leg Wave (Y) […]
-
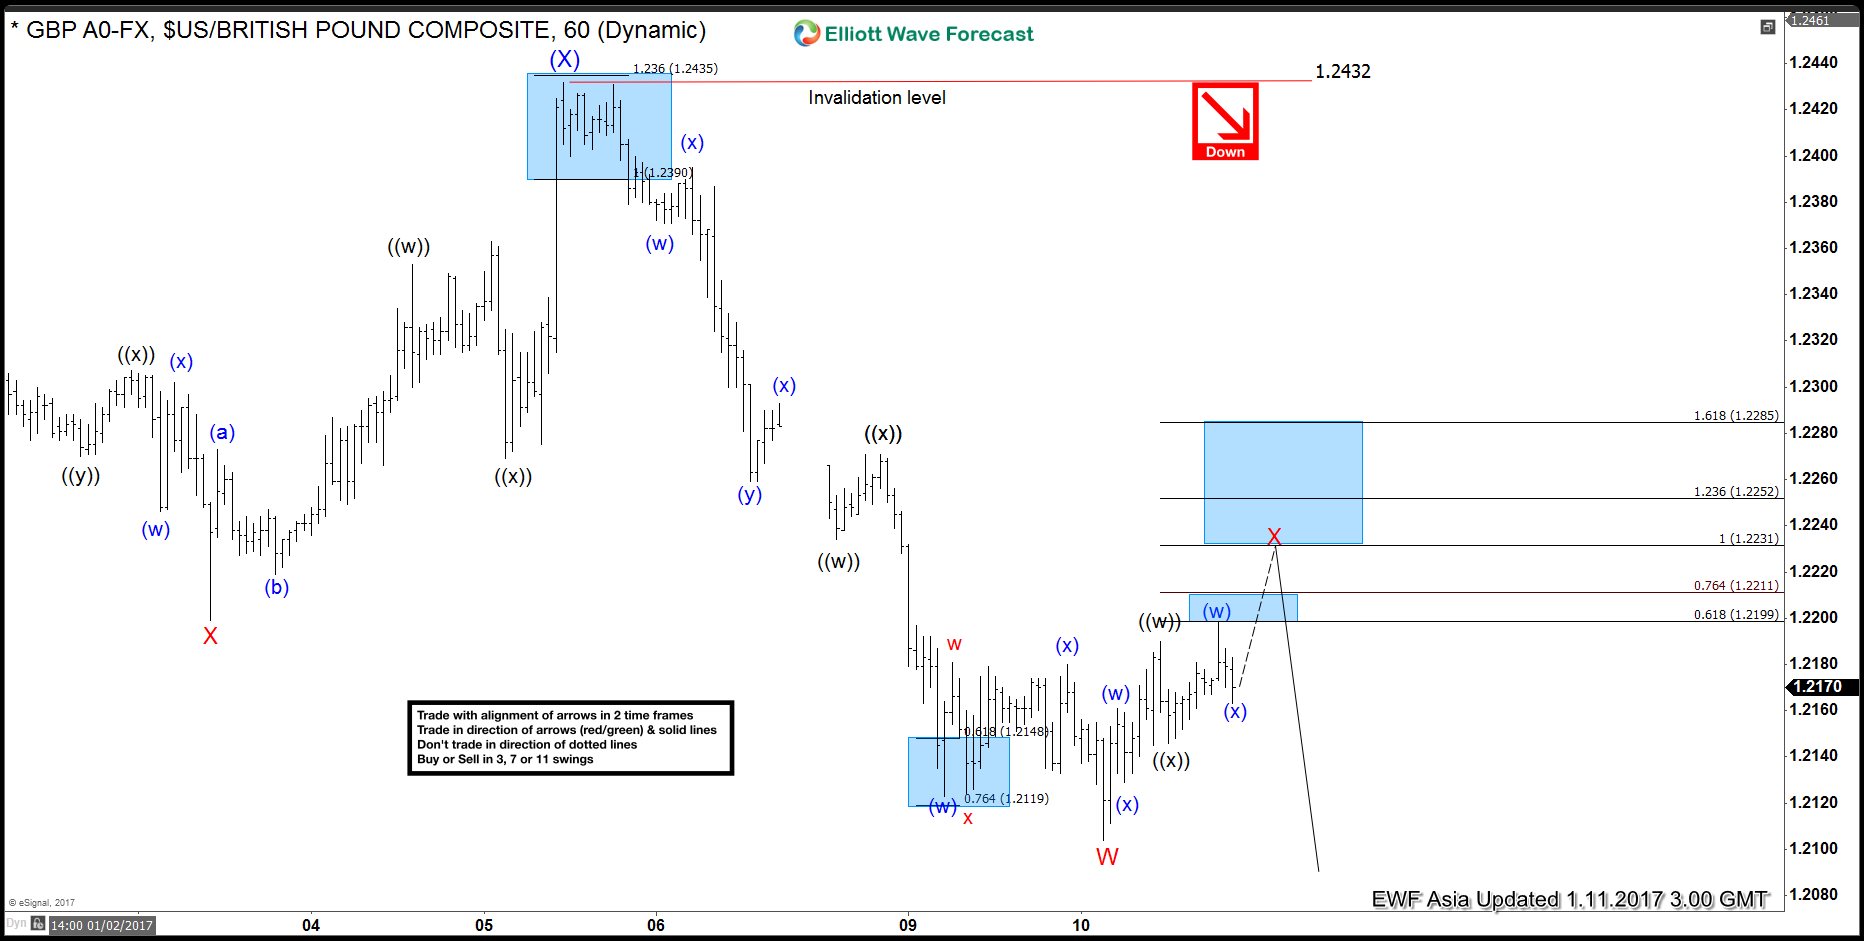
GBPUSD Elliott Wave Forecast 1.11.2017
Read MoreGBPUSD is showing a 5 swing bearish sequence from 12/6 peak (1.277) which favors more downside. The decline from 12/6 peak is unfolding as a double three where wave (W) ended at 1.2198 and wave (X) ended at 1.2432. GBPUSD has since broken below wave (W) at 1.2198 which suggests that the next leg Wave (Y) […]