
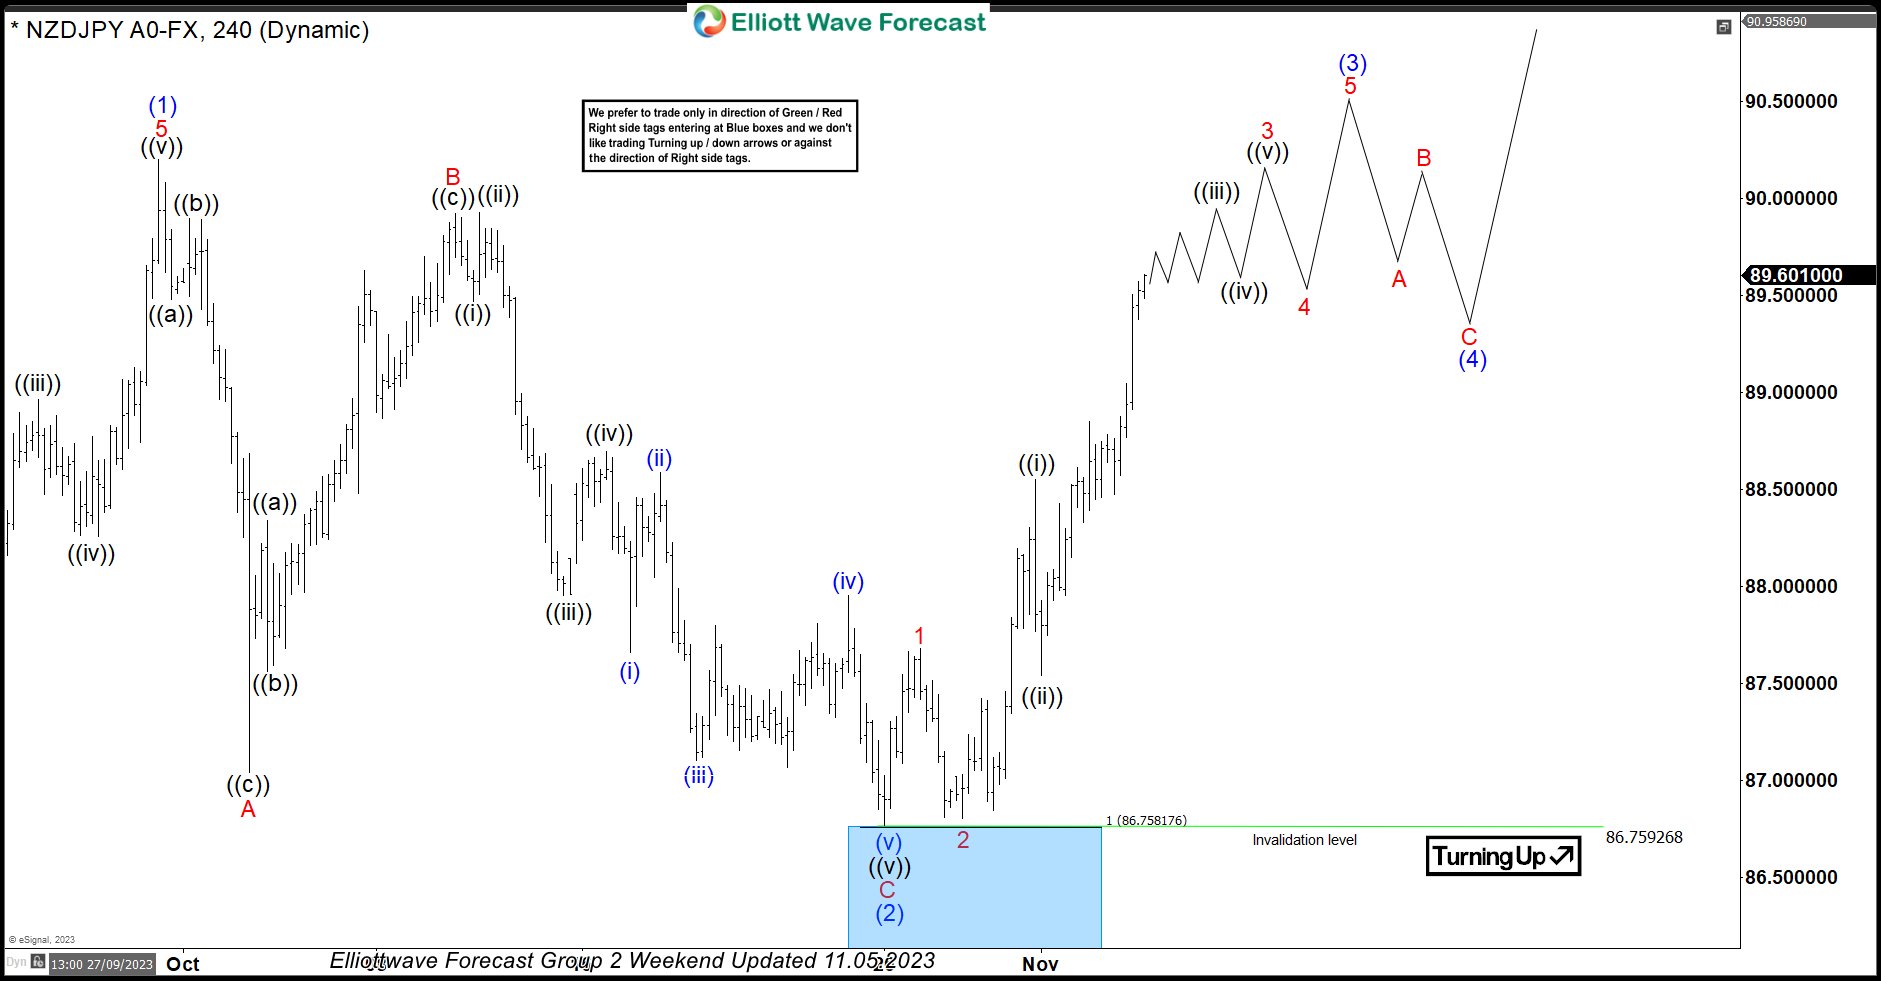
In this technical blog, we will look at the past performance of the 4-hour Elliott Wave Charts of NZDJPY. In which, the rally from 24 March 2023 low unfolded as an impulse sequence and showed a higher high sequence. Therefore, we knew that the structure in NZDJPY is incomplete to the upside & should extend higher. So, […]
-
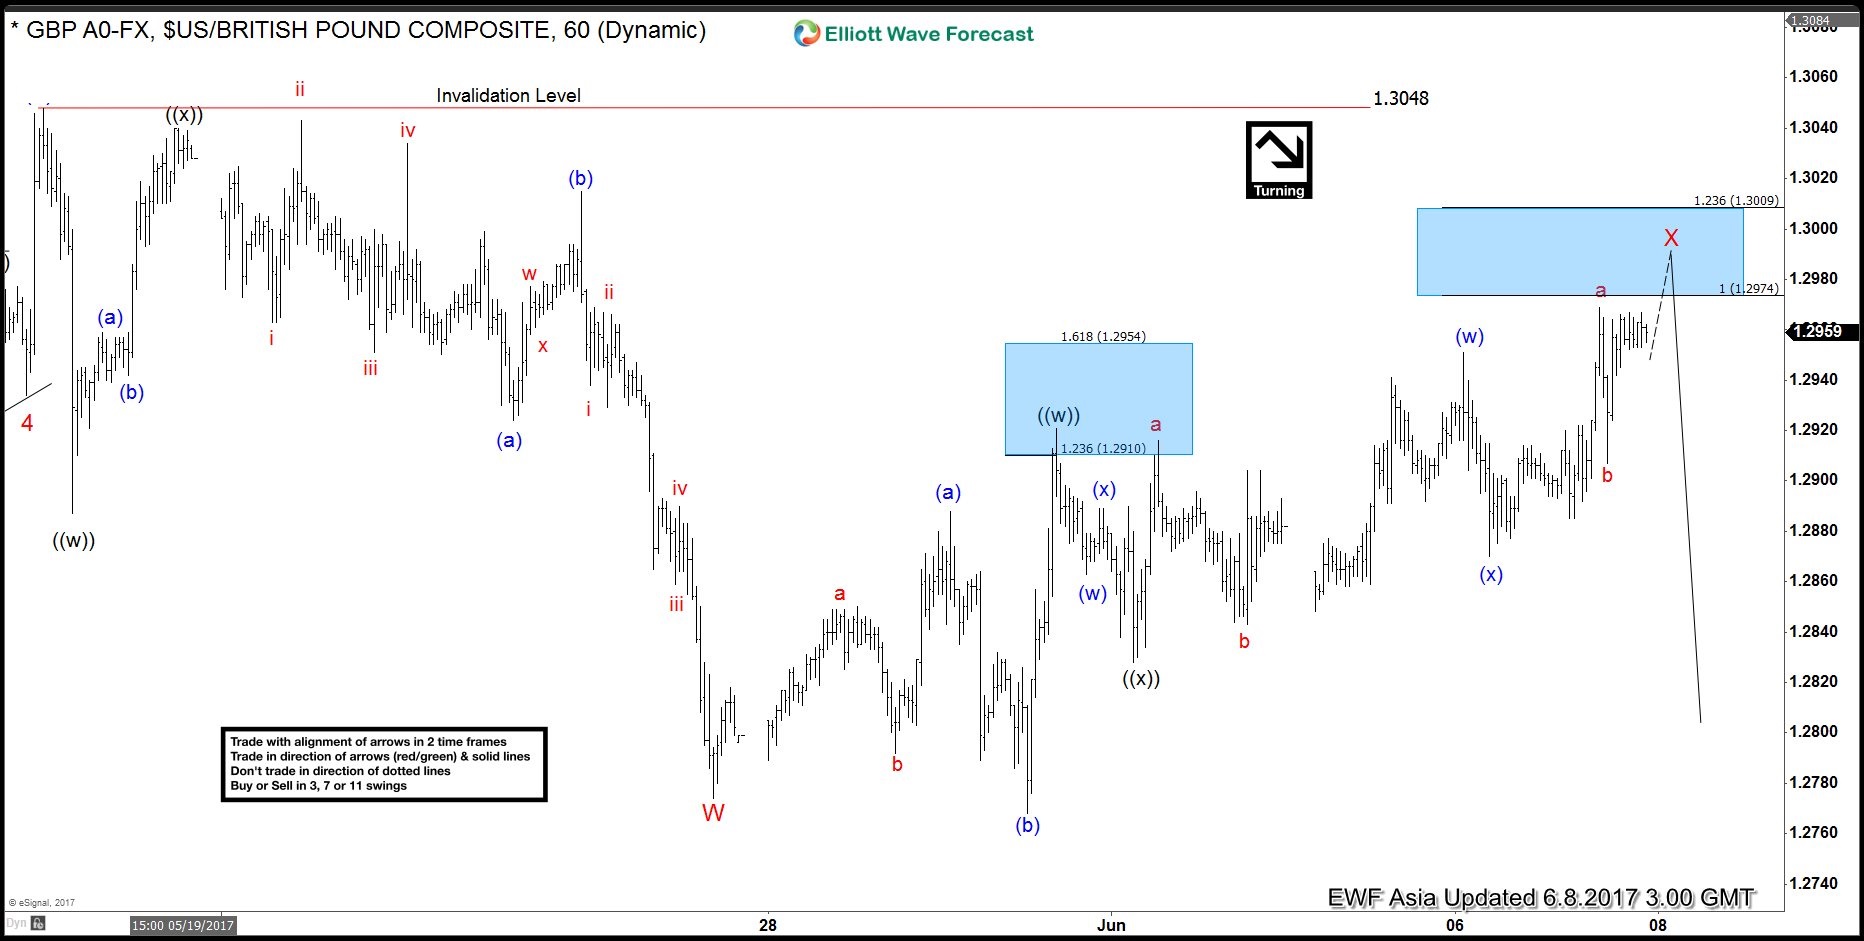
GBP reaction after UK Election (GE2017)
Read MoreThe pound sterling was headed for the biggest drop in a year after it emerged that the ruling Conservative Party has fallen short of a general majority after UK Election (GE 2017), just 10 days before the Brexit talks are scheduled to begin. The currency collapsed in front of all its main counterparts, since the supporters […]
-
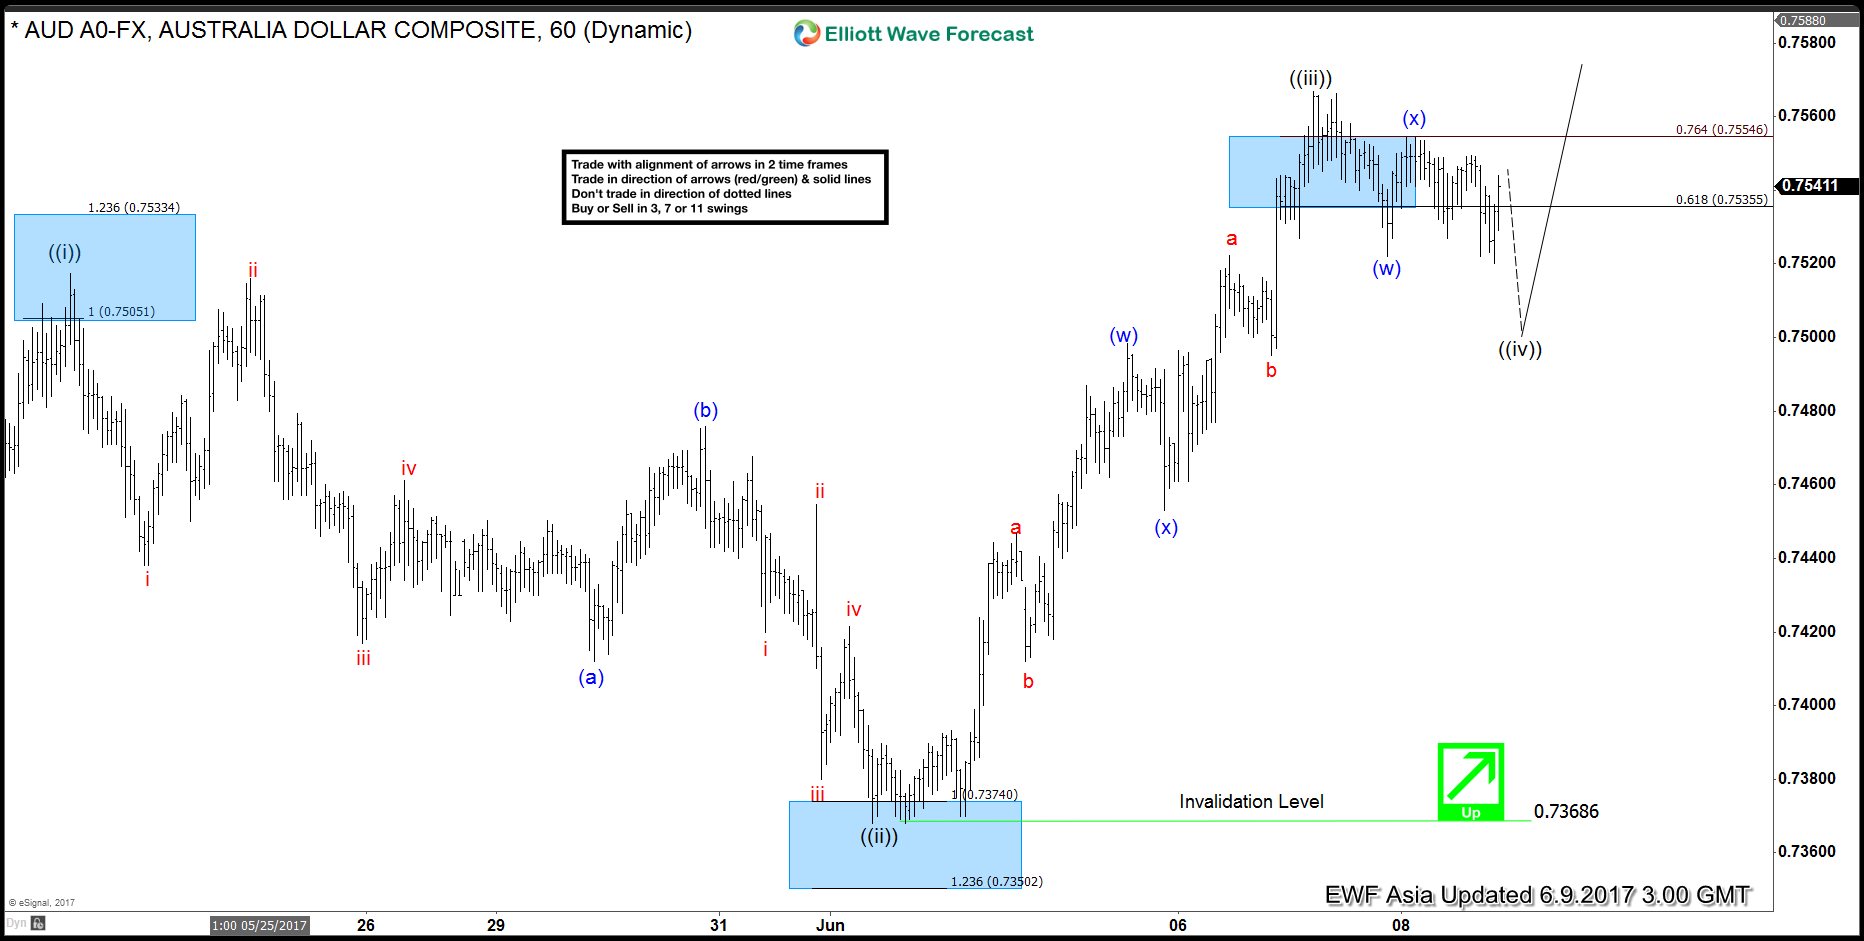
AUDUSD Elliott Wave Analysis 6.9.2017
Read MoreRevised short term AUDUSD Elliott Wave view suggests the rally from 5/9 low is unfolding as a leading diagonal Elliott Wave structure. Up from 5/9 (0.7325) low, Minute wave ((i)) ended at 0.7517, Minute wave ((ii)) ended at 0.7368, and Minute wave ((iii)) ended at 0.7566. Minute wave ((iv)) pullback is currently in progress to correct cycle from 6/1 […]
-
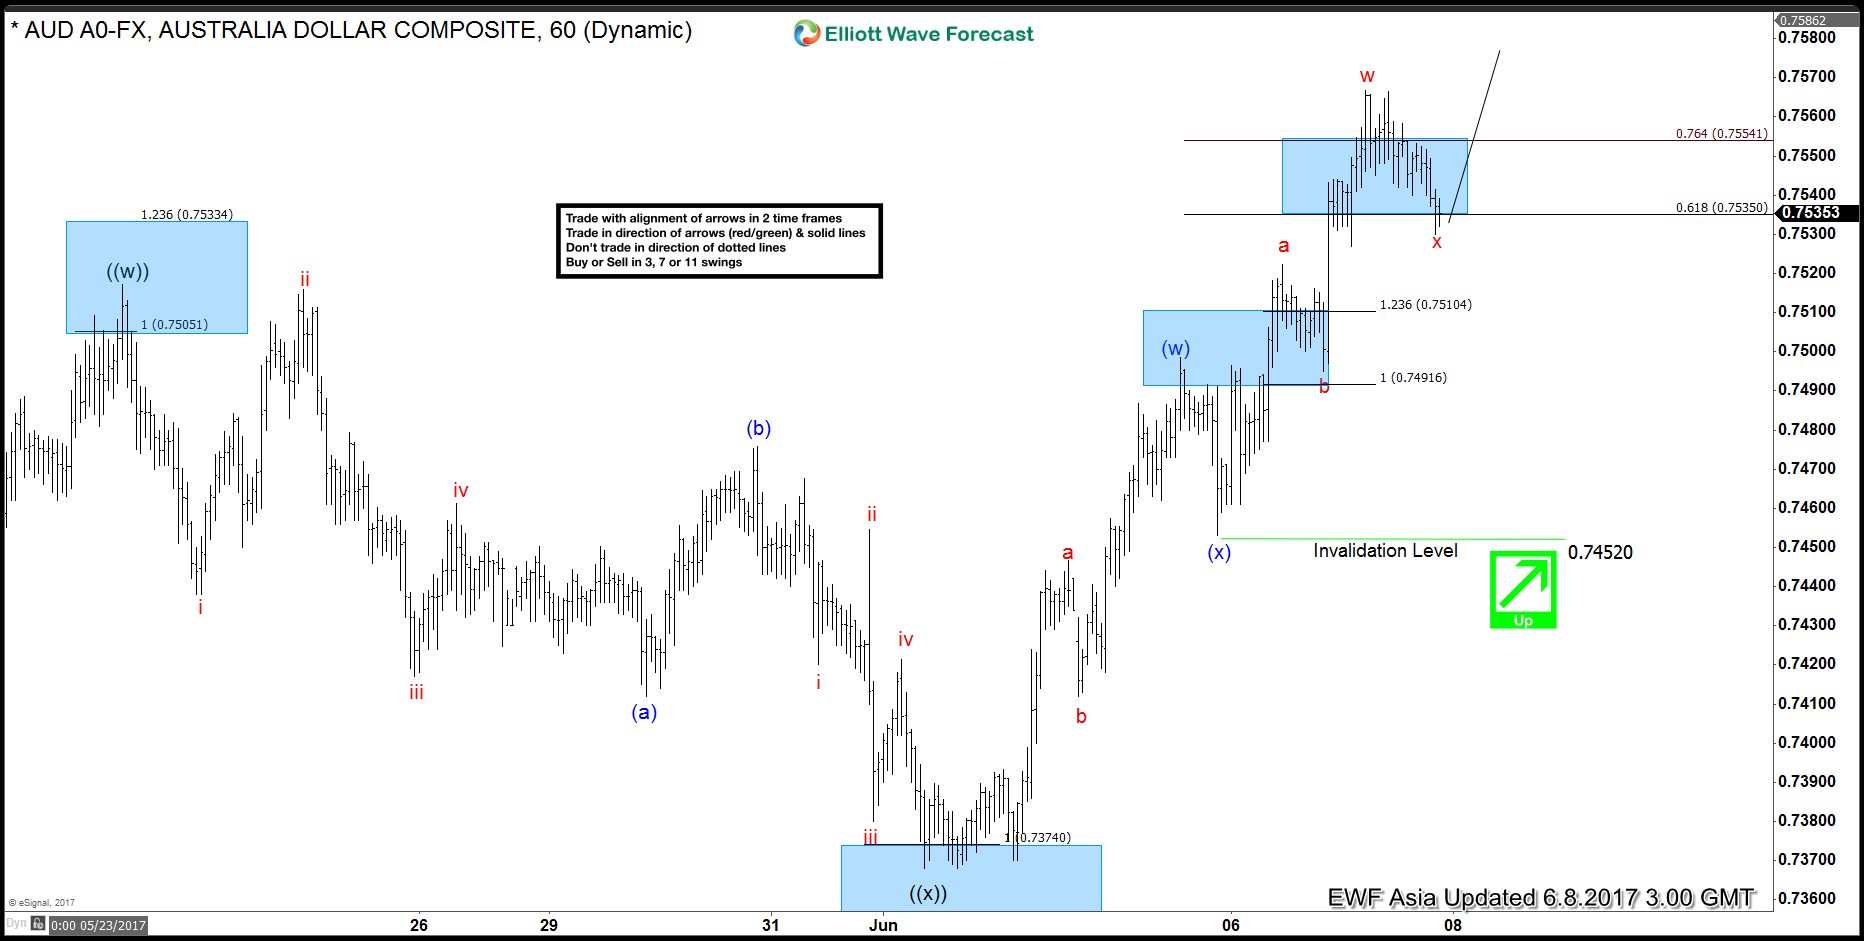
AUDUSD Elliott Wave View: Near Pullback
Read MoreShort Term AUDUSD Elliott Wave view suggests the rally from 5/9 low is unfolding as a double three Elliott Wave structure. Up from 5/9 (0.7325) low, Minute wave ((w)) ended at 0.7517 and Minute wave ((x)) ended at 0.7368. Pair has since broken above 0.7517, adding validity that the next leg higher has started. From 0.7368 low, the rally is […]
-
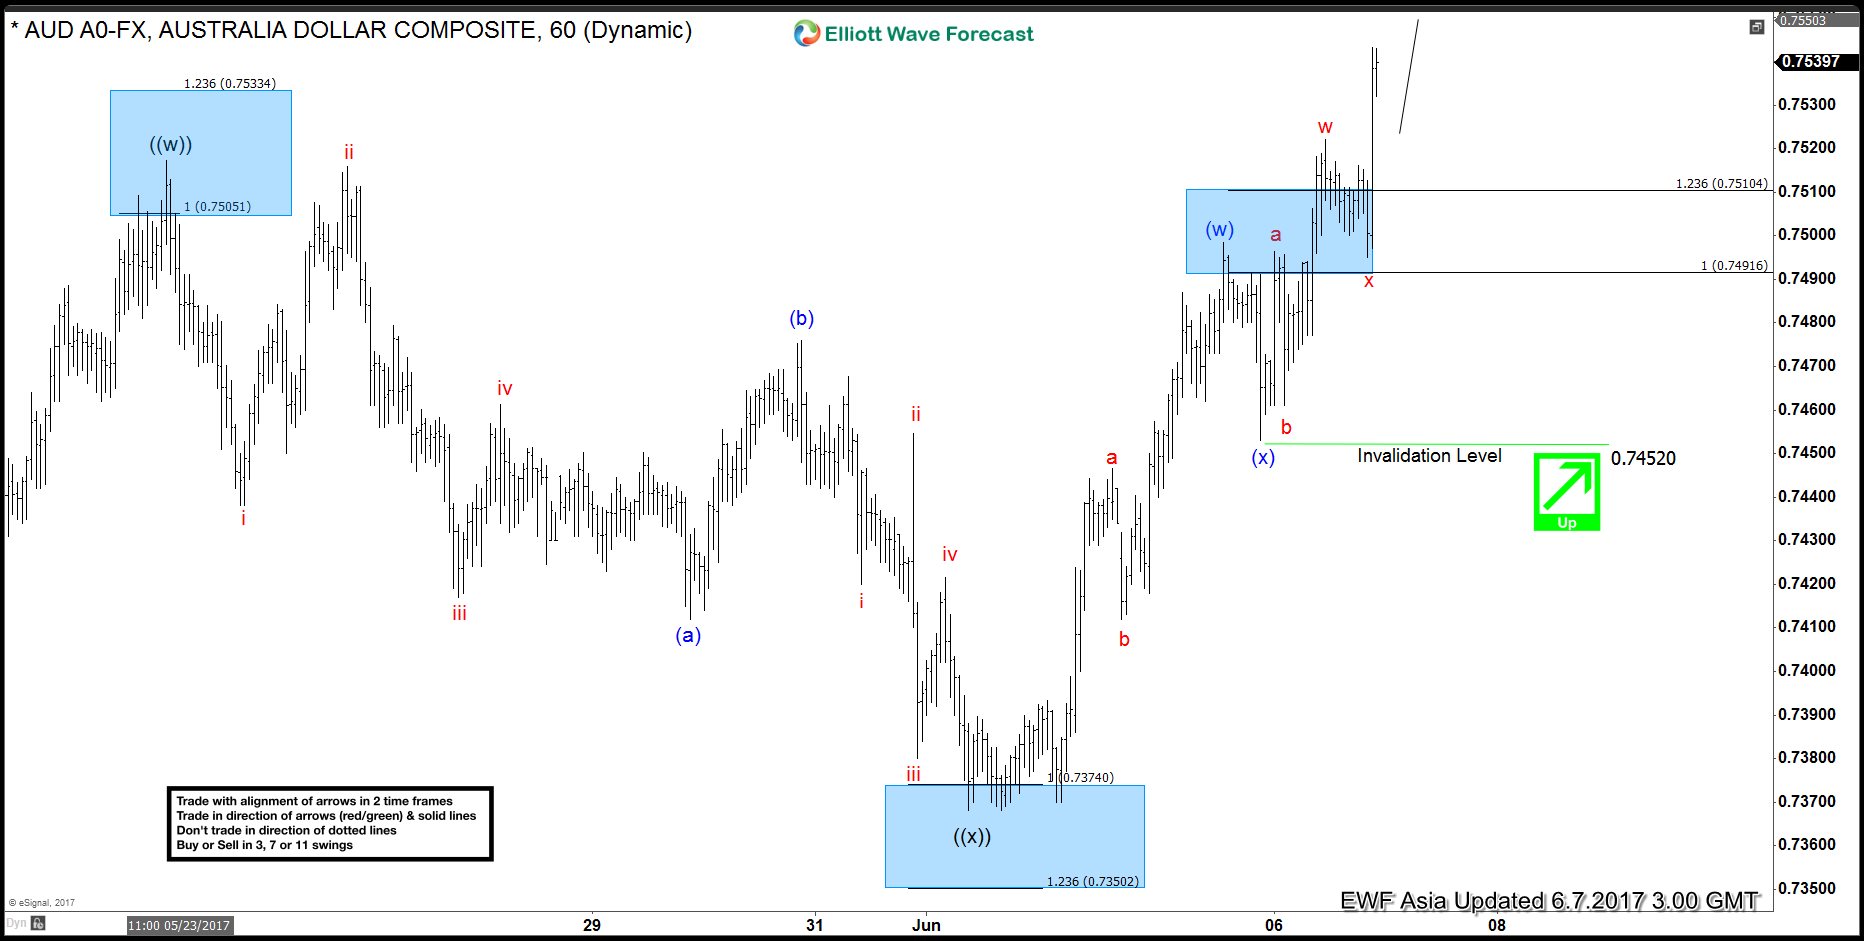
AUDUSD Elliott Wave View: More Upside
Read MoreShort Term Elliott Wave view in AUDUSD suggests the rally from 5/9 low is unfolding as a double three Elliott Wave structure. Up from 5/9 (0.7325) low, Minute wave ((w)) ended at 0.7517 and Minute wave ((x)) ended at 0.7368. Pair has since broken above 0.7517, adding validity that the next leg higher has started. From 0.7368 low, the rally […]
-
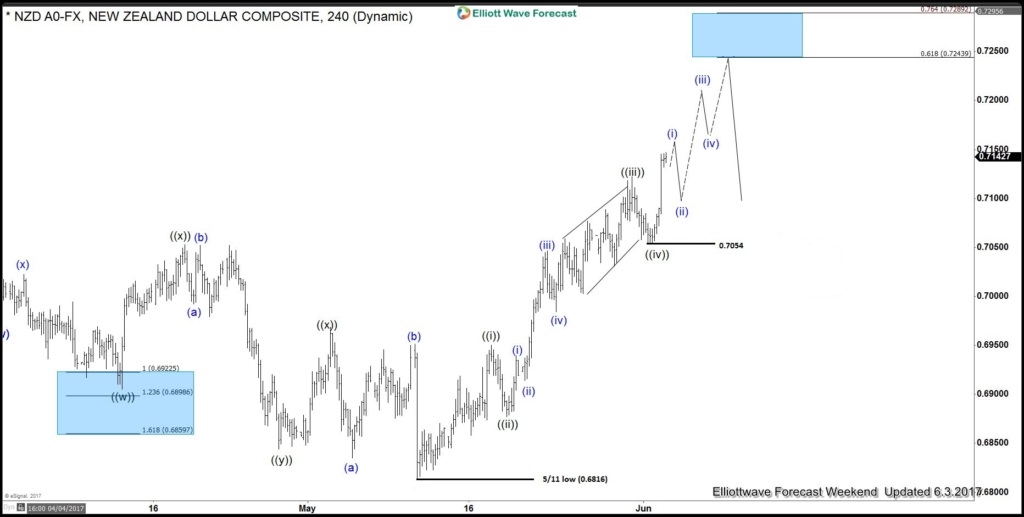
NZDUSD Elliott Wave View: Showing impulse
Read MoreShort term Elliott wave view in NZDUSD suggest that the cycle from 5/11 low (0.6816) is unfolding as an impulsive Elliott wave structure . This 5 wave move could be a wave C of a FLAT correction or wave A of an Elliott wave zigzag structure structure. In either case, after 5 wave move ends, pair should pull back in 3 waves at […]
-
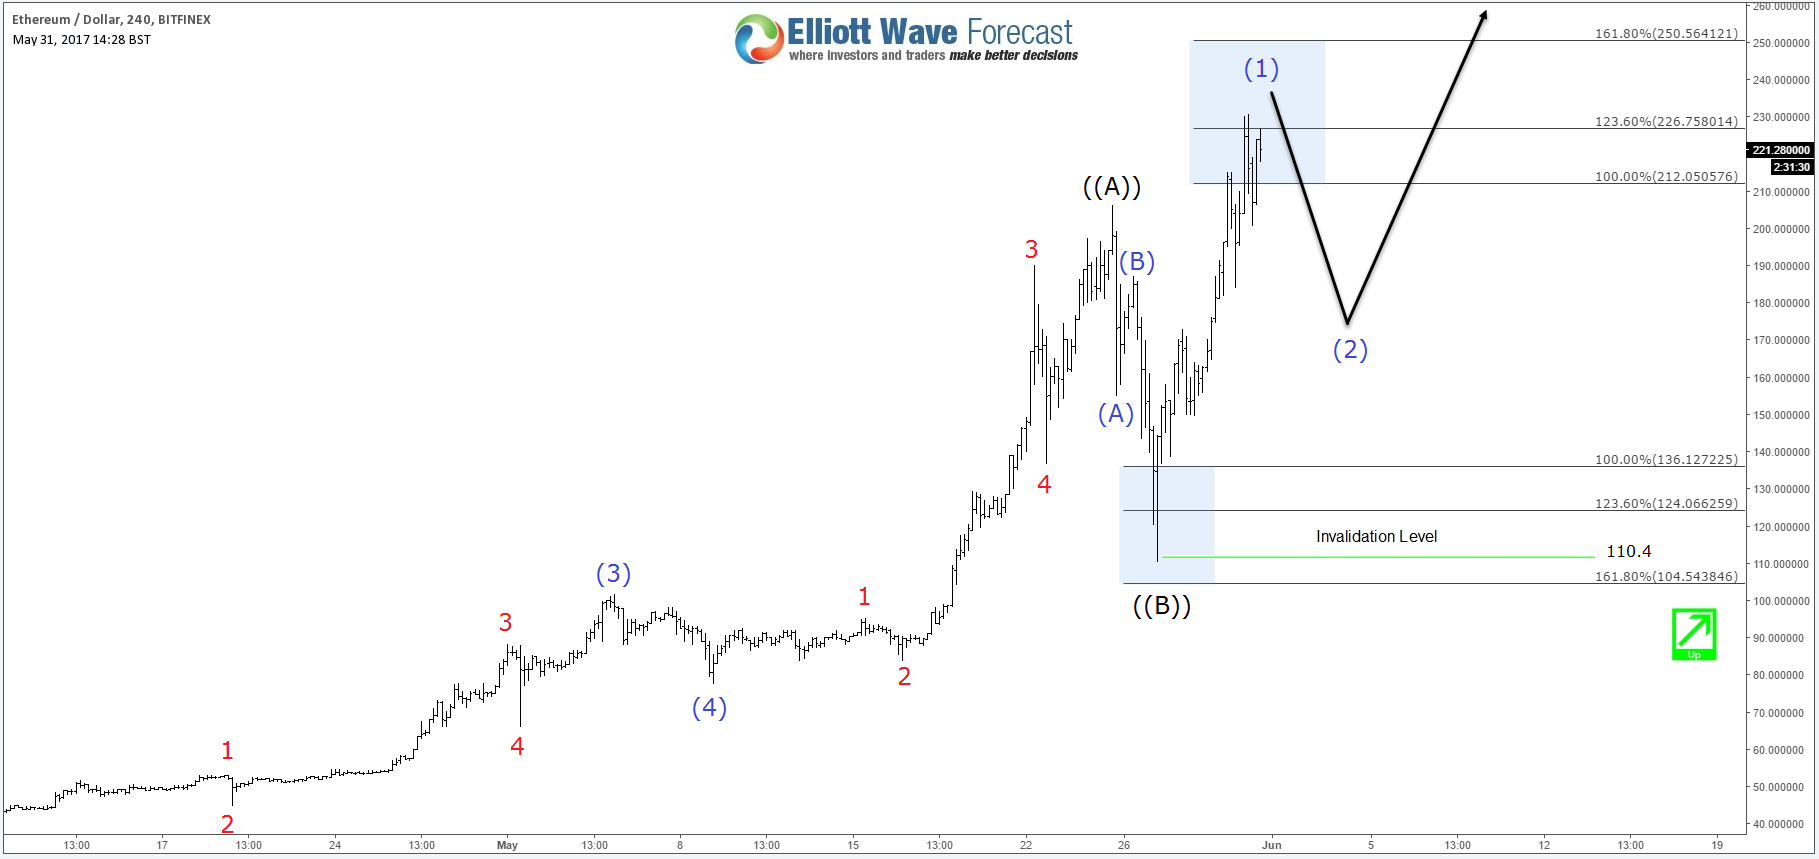
Ethereum showing Elliott Wave path for Bitcoin
Read MoreEthereum is an open-source blockchain-based distributed computing platform featuring smart contract functionality. It provides a decentralized Turing-complete virtual machine, the Ethereum Virtual Machine (EVM), which can execute scripts using an international network of public nodes. Ethereum also provides a crypto-currency token called “ether”, which can be transferred between accounts and used to compensate participant nodes […]